Fig. 1.
Download original image
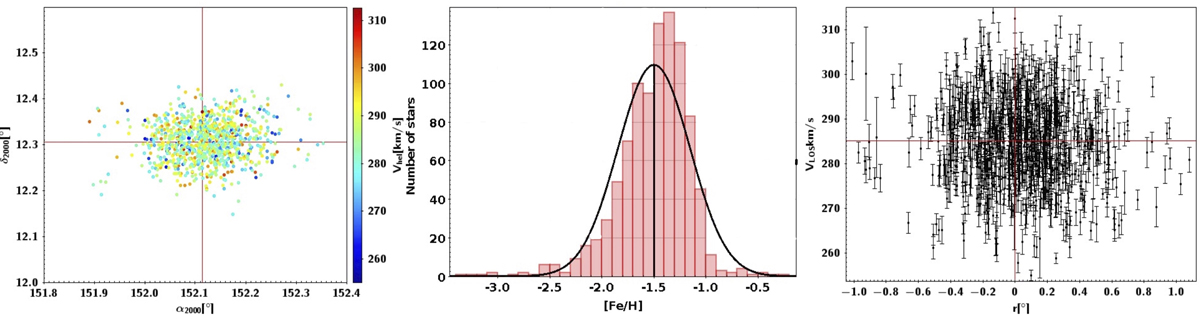
Illustration of our Leo I data set. The left panel shows the spatial distribution of the stars, colour-coded by velocity. The middle panel shows the metallicity distribution; the mean metallicity for the galaxy is shown (black curve). The right panel shows the radial velocities as a function of right ascension, which closely corresponds to the major axis of the galaxy.
Current usage metrics show cumulative count of Article Views (full-text article views including HTML views, PDF and ePub downloads, according to the available data) and Abstracts Views on Vision4Press platform.
Data correspond to usage on the plateform after 2015. The current usage metrics is available 48-96 hours after online publication and is updated daily on week days.
Initial download of the metrics may take a while.