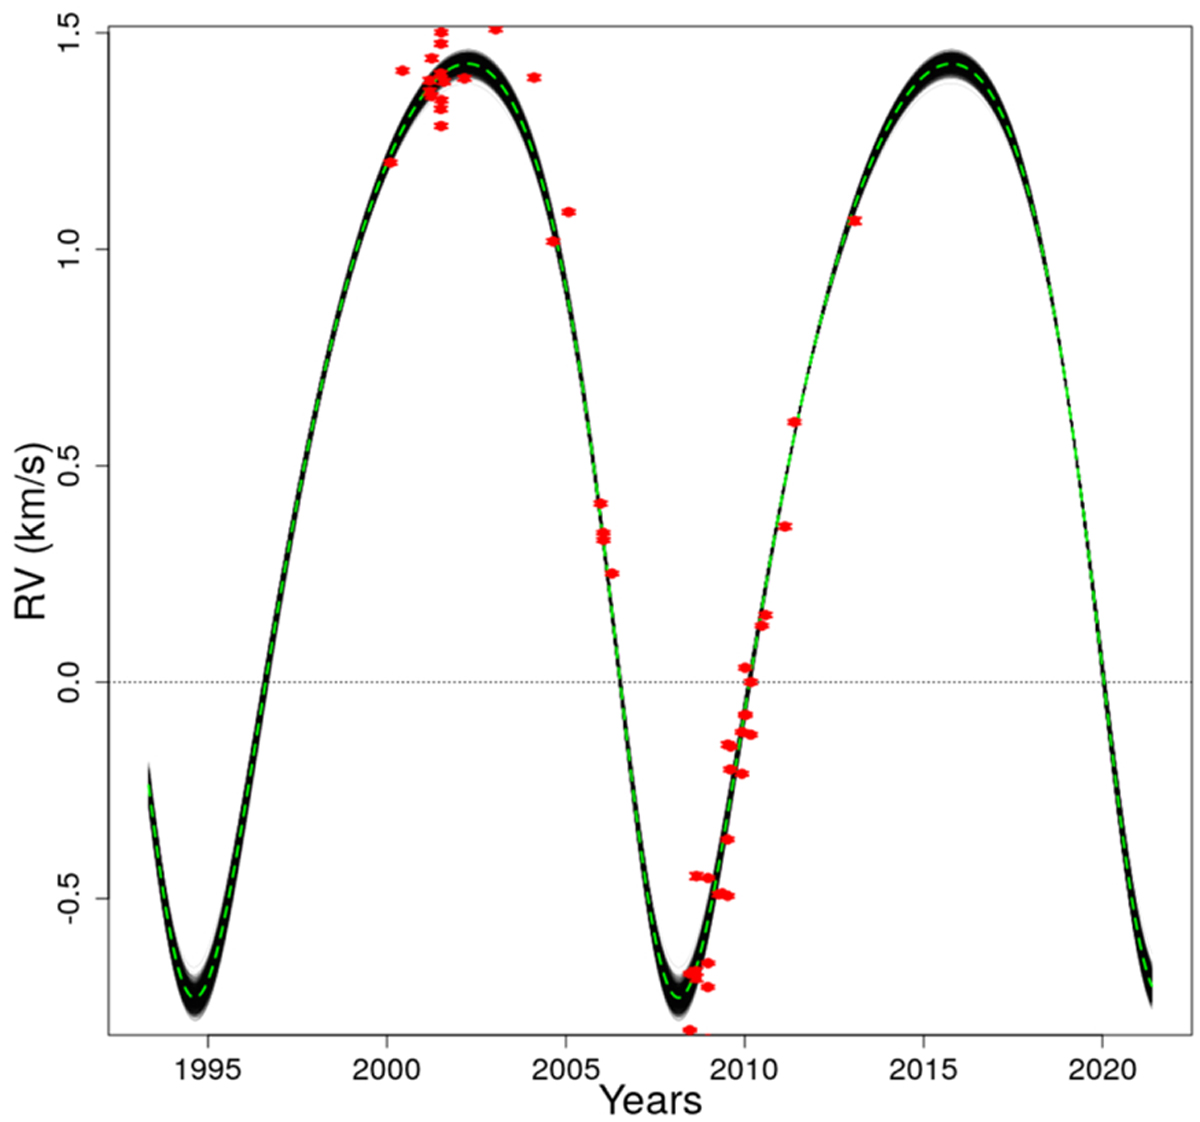
Fig. 2
Download original image
Radial velocity behaviour of Gl 494 predicted by the adjustment of the direct imaging, HIPPARCOS, and Gaia data. The best-fit orbit from TMB (values in Table 2) is the green dotted line and sample orbits from the MCMC are in black. The red dots represent the radial velocity observations with their associated error bars. The systemic velocity of 0.59 km s−1 was derived from a TMB adjustment of the radial velocities and the direct imaging data for the sole purpose of this visualisation.
Current usage metrics show cumulative count of Article Views (full-text article views including HTML views, PDF and ePub downloads, according to the available data) and Abstracts Views on Vision4Press platform.
Data correspond to usage on the plateform after 2015. The current usage metrics is available 48-96 hours after online publication and is updated daily on week days.
Initial download of the metrics may take a while.