Fig. 15.
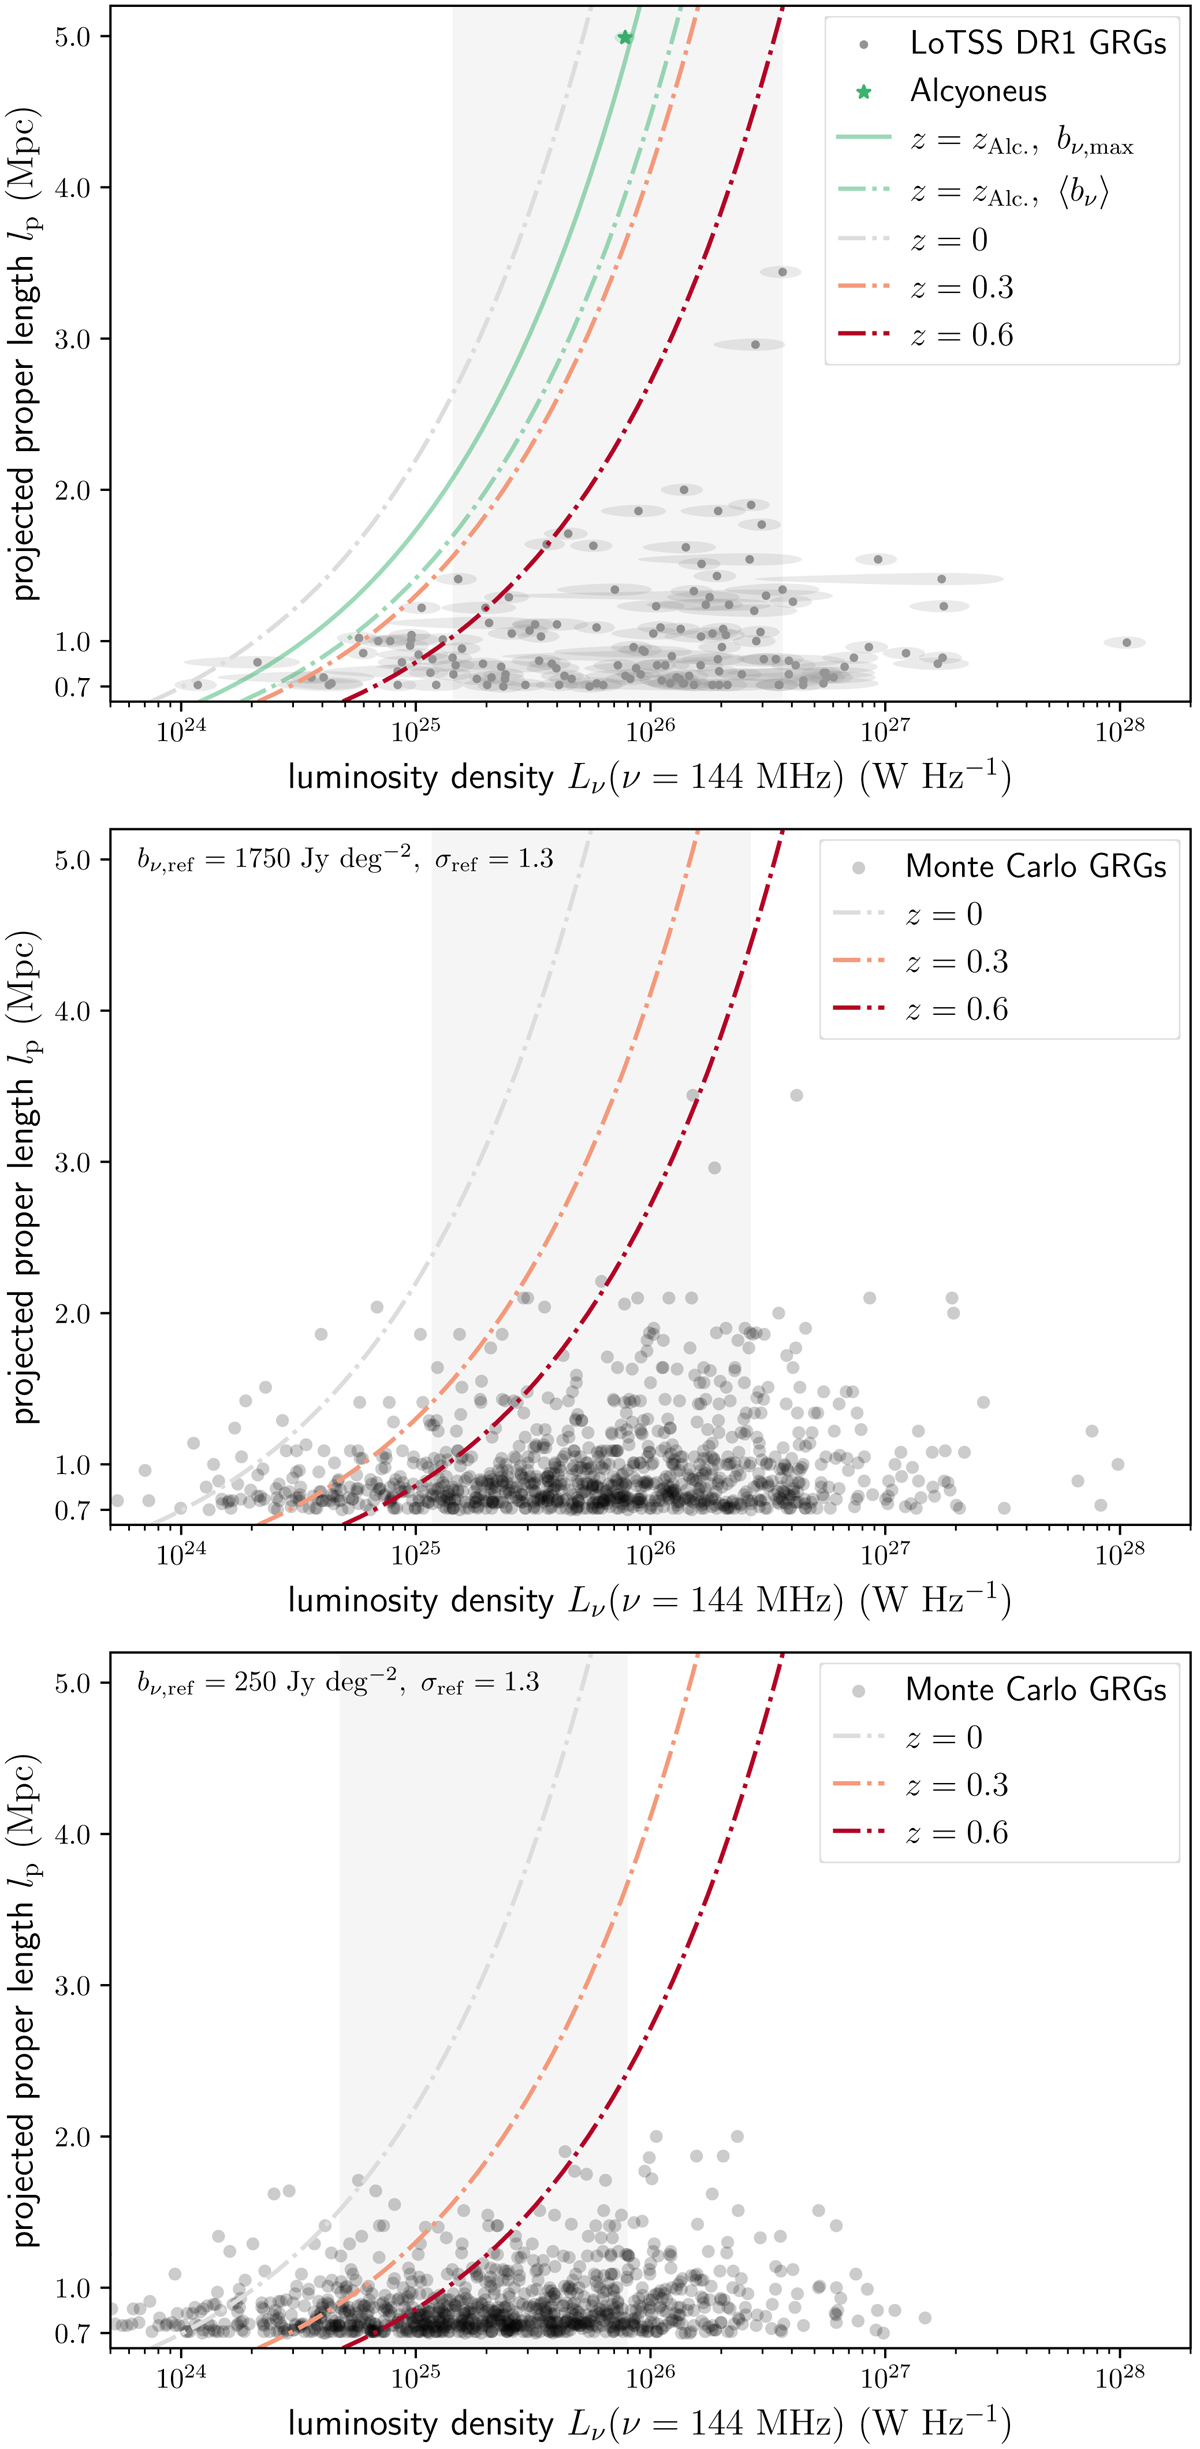
Download original image
Comparison between luminosity density–projected proper length relations for observed and simulated giants. Each dash-dotted curve denotes a family of giants at a given redshift, assuming fLν = 0.3 and fl = 0.3, whose mean lobe surface brightnesses equal the LoTSS DR2 noise level and who are thus borderline-detectable. The grey band denotes the median-centred luminosity density range that contains 68% of giants. Top: 139 LoTSS DR1 giants (Dabhade et al. 2020b), alongside Alcyoneus, with redshift zAlc. = 0.25 (Oei et al. 2022a). The solid green curve is similar to the dash-dotted green curve, but represents maximum instead of mean lobe surface brightness. Middle: 1000 simulated giants, assuming bν, ref = 1750 Jy deg−2 and σref = 1.3. Bottom: 1000 simulated giants, assuming bν, ref = 250 Jy deg−2 and σref = 1.3.
Current usage metrics show cumulative count of Article Views (full-text article views including HTML views, PDF and ePub downloads, according to the available data) and Abstracts Views on Vision4Press platform.
Data correspond to usage on the plateform after 2015. The current usage metrics is available 48-96 hours after online publication and is updated daily on week days.
Initial download of the metrics may take a while.