Fig. 14.
Download original image
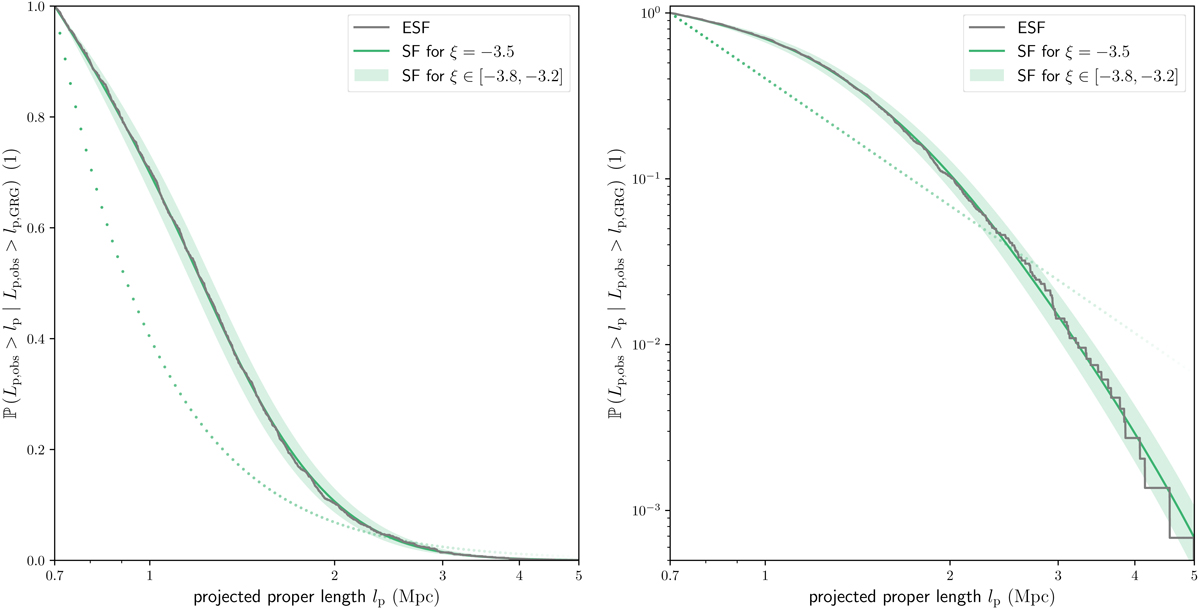
Empirical survival function of the observed giant radio galaxy projected proper length RV (ESF; dark grey) and the corresponding survival function 1 − FLp, obs | Lp, obs > lp, GRG (SF; green curve) using the maximum a posteriori probability parameters (MAP; see Table 4). Observed GRG projected lengths are well described by a Pareto distribution modified to include selection effects. Keeping the selection effect parameters fixed, we show how models vary with tail index ξ (green range). We also show the selection effect–free SF 1 − FLp | Lp > lp, GRG using the MAP ξ (green dots). We included all LoTSS DR2 search campaign giants up to zmax = 0.5. Left: logarithmic horizontal axis and linear vertical axis. Right: logarithmic horizontal axis and logarithmic vertical axis.
Current usage metrics show cumulative count of Article Views (full-text article views including HTML views, PDF and ePub downloads, according to the available data) and Abstracts Views on Vision4Press platform.
Data correspond to usage on the plateform after 2015. The current usage metrics is available 48-96 hours after online publication and is updated daily on week days.
Initial download of the metrics may take a while.