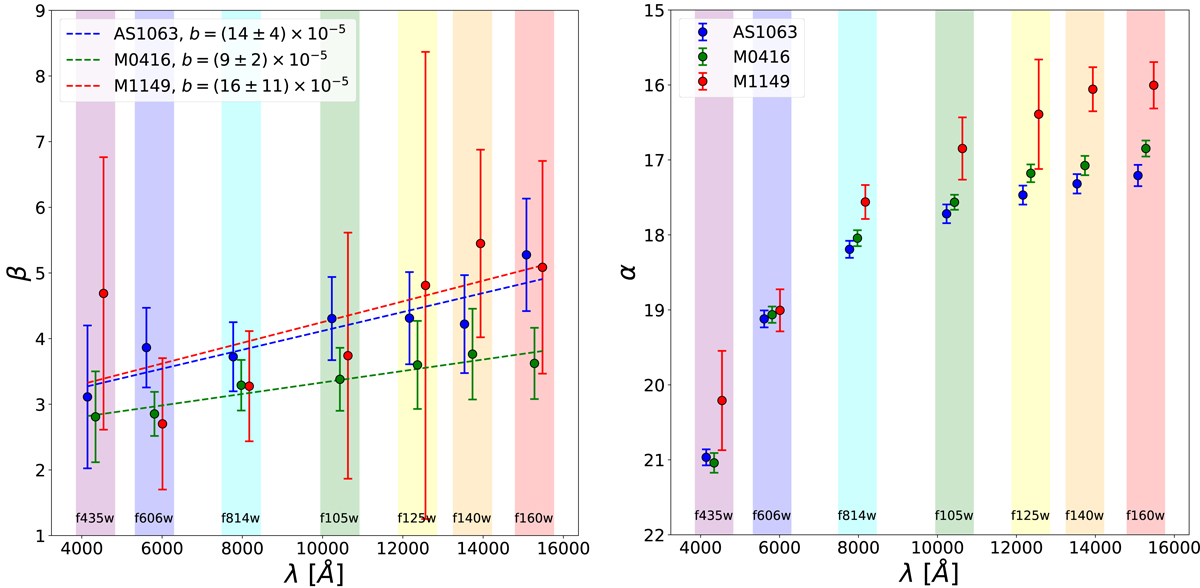
Fig. 1.
Download original image
Best-fitting KR slope β (left panel) and intercept α (right panel) evolution as a function of wavelength for AS1063, M0416, and M1149 (blue, green, and red points, respectively). The scatter points refer to the best-fitting KR slopes and intercepts obtained from the linear regression on the galaxy structural parameters measured with MORPHOFIT. The dashed lines in the left panel represent the best-fitting linear relations that describe the trend of increasing slope values as a function of wavelength for the three clusters. The coloured bands group the scatter points belonging to the same waveband, which are displaced for clarity. The left plot legend shows the slope values and their 1σ uncertainties.
Current usage metrics show cumulative count of Article Views (full-text article views including HTML views, PDF and ePub downloads, according to the available data) and Abstracts Views on Vision4Press platform.
Data correspond to usage on the plateform after 2015. The current usage metrics is available 48-96 hours after online publication and is updated daily on week days.
Initial download of the metrics may take a while.