Open Access
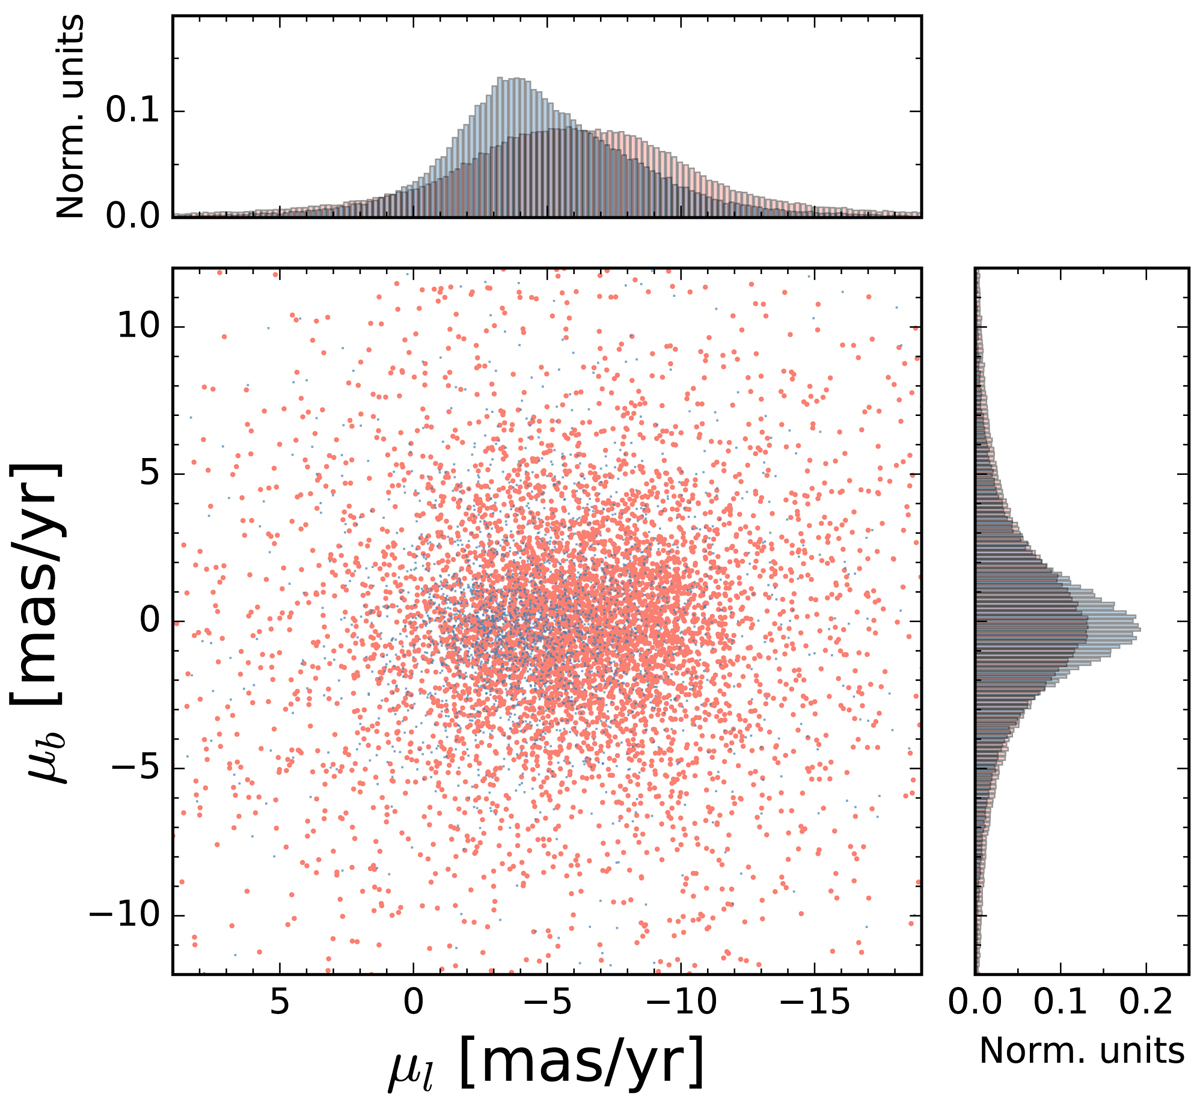
Fig. 3.
Download original image
Proper motion distribution of stars from each of the target groups. The blue and salmon dots indicate stars from the NSD outer and inner regions, respectively. Only a fraction of the stars is shown to not overcrowd the plot.
Current usage metrics show cumulative count of Article Views (full-text article views including HTML views, PDF and ePub downloads, according to the available data) and Abstracts Views on Vision4Press platform.
Data correspond to usage on the plateform after 2015. The current usage metrics is available 48-96 hours after online publication and is updated daily on week days.
Initial download of the metrics may take a while.