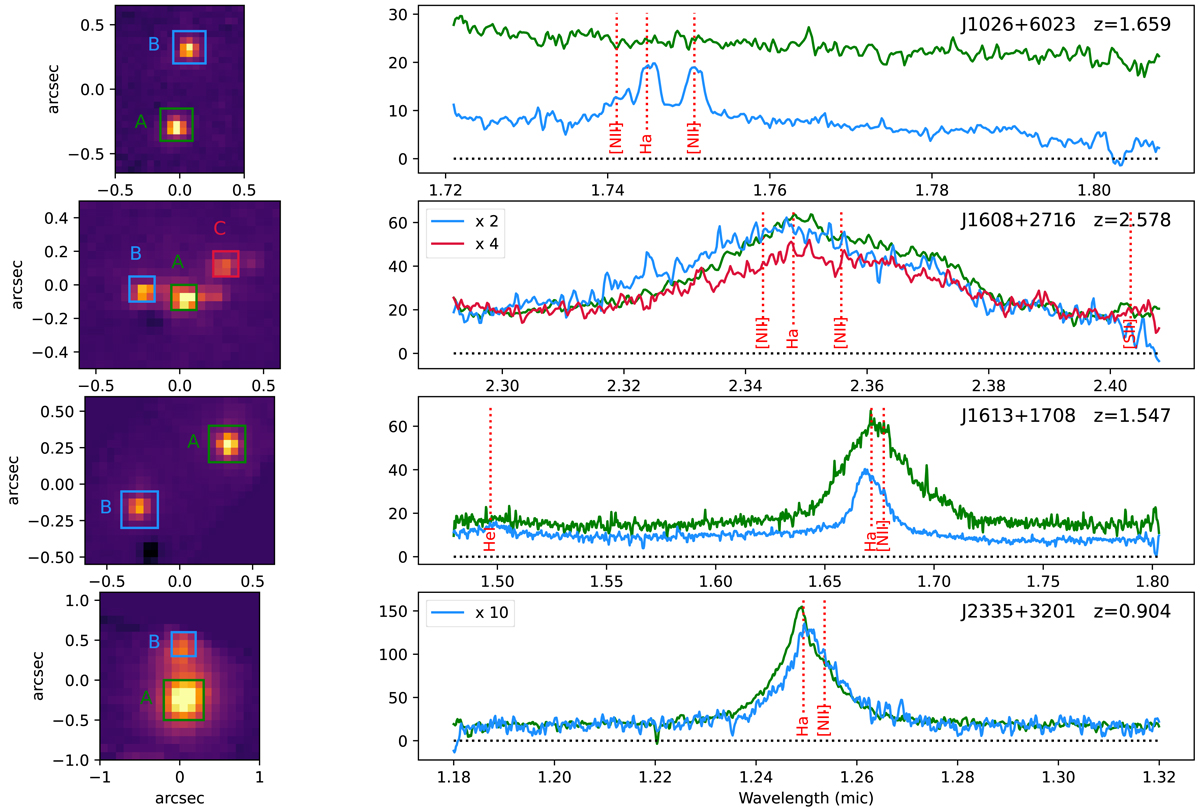
Fig. 1.
Download original image
Hα emission line maps (left) and spectra (right) of the systems observed with OSIRIS (the target name and redshift are reported in the right panels). The line maps are oriented with north being up and west to the right. The spectra shown in the right panels have been extracted over the squared apertures marked in the left panels (with the same color-coding). Each component of the systems is labeled as in Table 2. To optimize the visualization, some of the spectra have been multiplied by the factors indicated in the labels. Vertical dotted lines show the position of the main expected emission lines.
Current usage metrics show cumulative count of Article Views (full-text article views including HTML views, PDF and ePub downloads, according to the available data) and Abstracts Views on Vision4Press platform.
Data correspond to usage on the plateform after 2015. The current usage metrics is available 48-96 hours after online publication and is updated daily on week days.
Initial download of the metrics may take a while.