Fig. 8.
Download original image
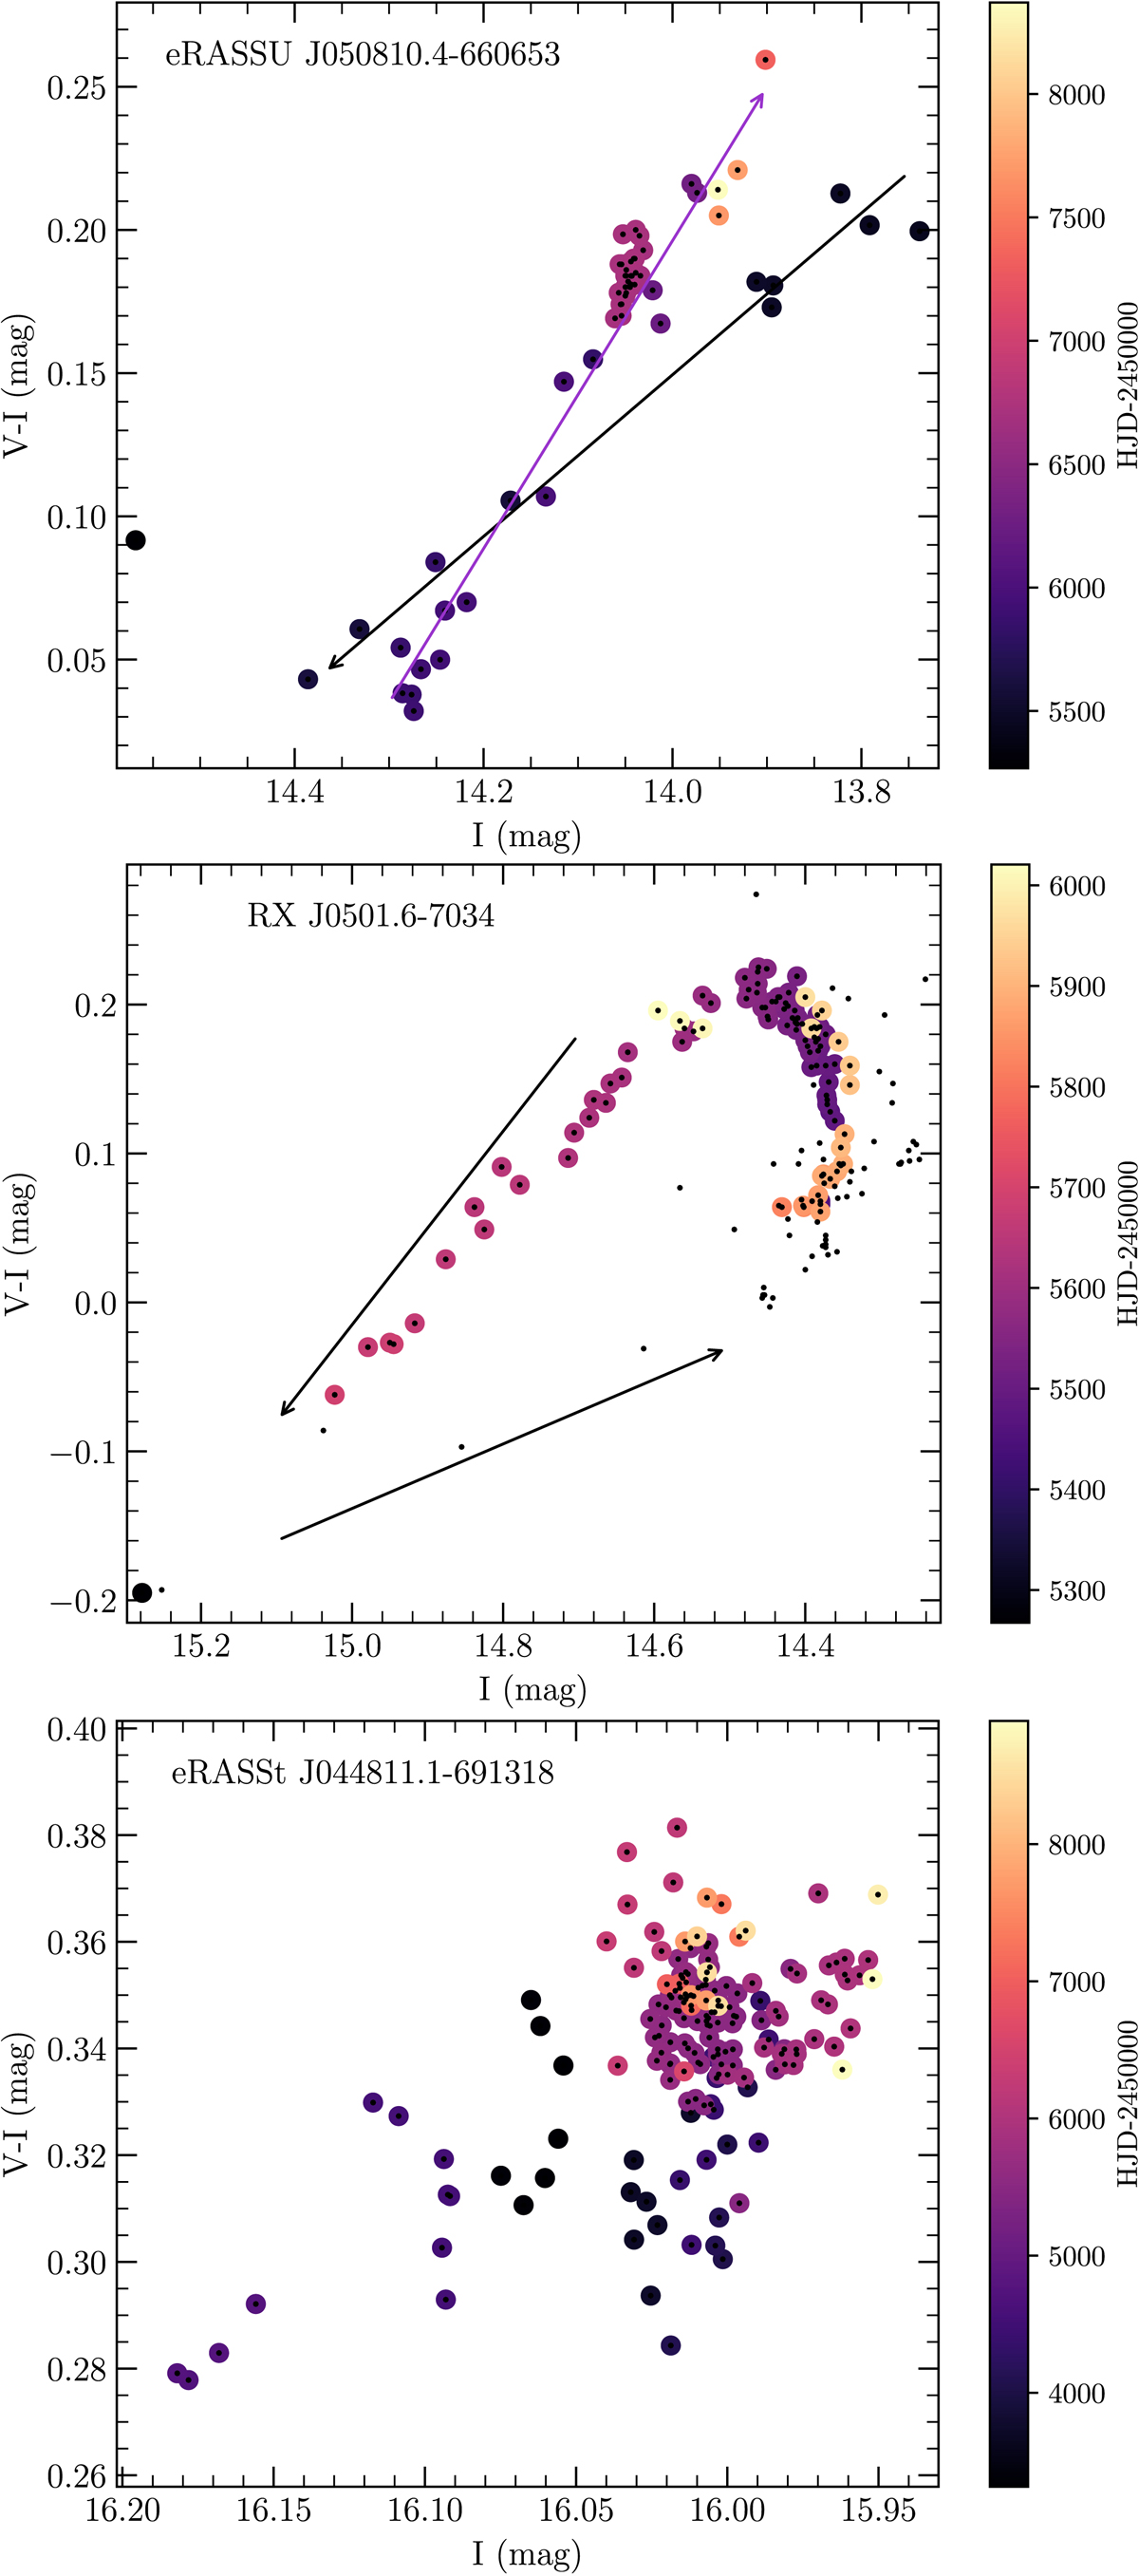
OGLE V-I colour index as a function of I for eRASSU J050810.4–660653 (top), RX J0501.6–7034 (middle), and eRASSt J044811.1–691318 (bottom). The I values are interpolated to the times of the V-band observations. Due to the fast brightness changes seen from RX J0501.6–7034 the interpolated I values are only used when an I measurement exists within five days of the V-band observation.
Current usage metrics show cumulative count of Article Views (full-text article views including HTML views, PDF and ePub downloads, according to the available data) and Abstracts Views on Vision4Press platform.
Data correspond to usage on the plateform after 2015. The current usage metrics is available 48-96 hours after online publication and is updated daily on week days.
Initial download of the metrics may take a while.