Fig. 7.
Download original image
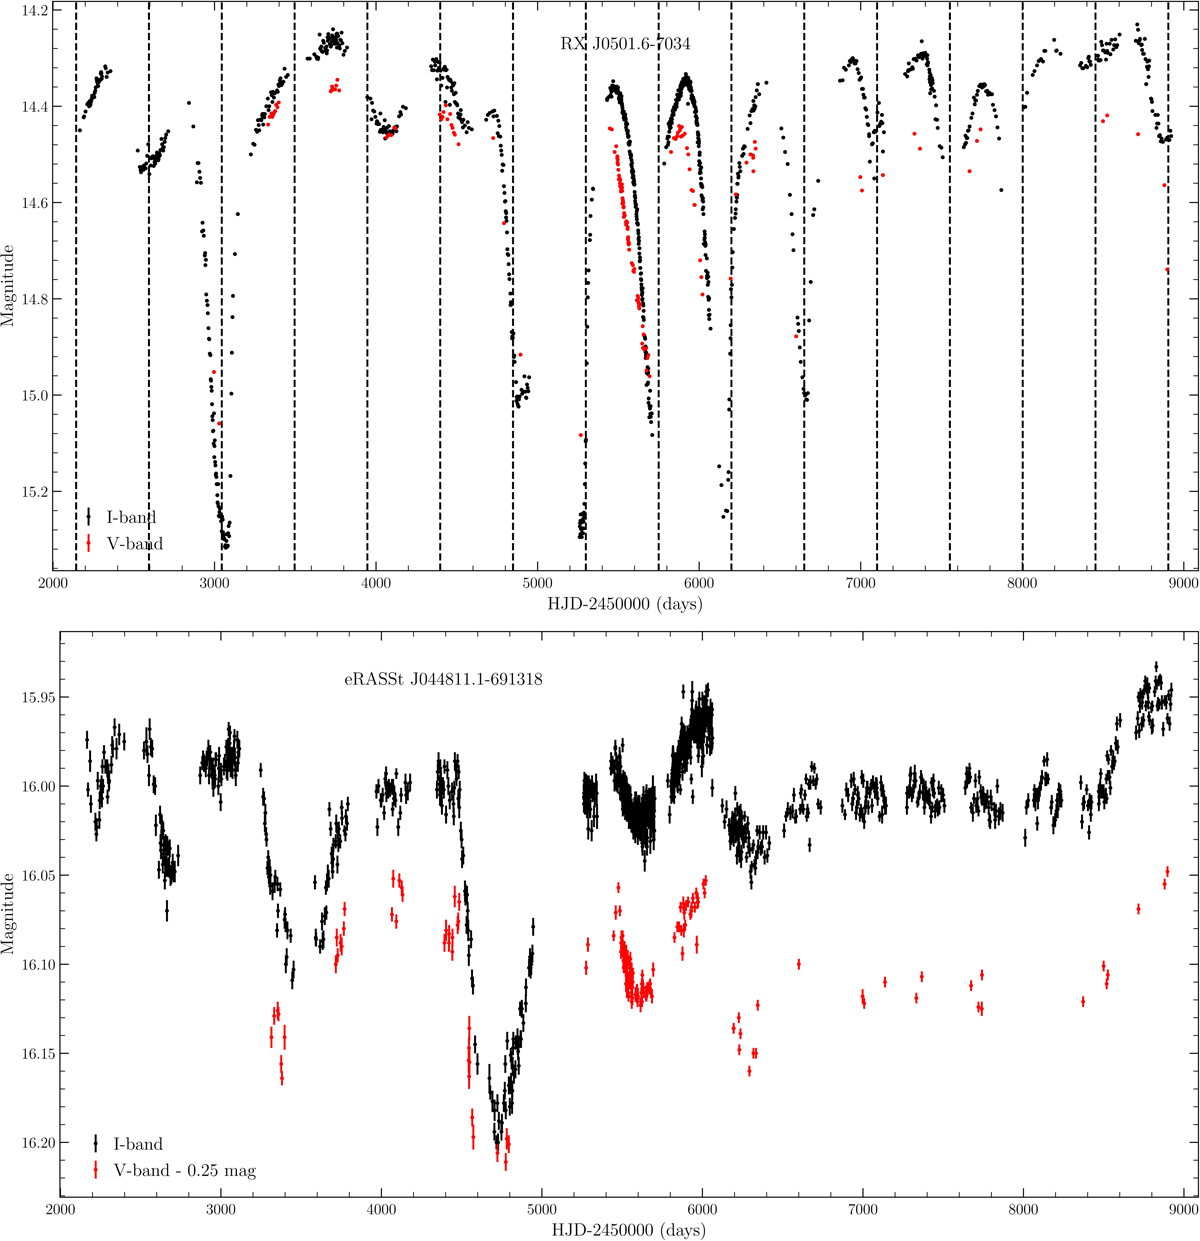
I-band light curves (black) of RX J0501.6–7034 (top; between 2001 September 14 and 2020 March 13) and eRASSt J044811.1–691318 (bottom; 2001 September 13 to 2020 March 13) from OGLE phases III and IV. V-band measurements are available for both systems and shown in red. The vertical dashed lines in the top panel are separated by 450.7 days, the period indicated by the LS periodogram analysis.
Current usage metrics show cumulative count of Article Views (full-text article views including HTML views, PDF and ePub downloads, according to the available data) and Abstracts Views on Vision4Press platform.
Data correspond to usage on the plateform after 2015. The current usage metrics is available 48-96 hours after online publication and is updated daily on week days.
Initial download of the metrics may take a while.