Open Access
Fig. A.3.
Download original image
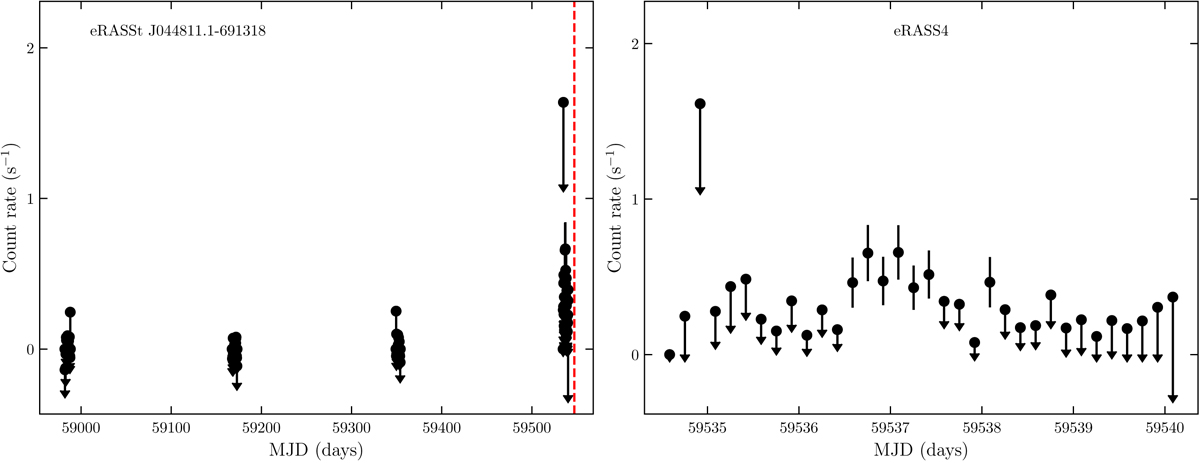
eROSITA light curve of eRASSt J044811.1–691318, created as described in Fig. A.1. The red dashed line marks the beginning of the XMM-Newton observation, which was performed shortly after the last source scans during eRASS4. The source was not detected during eRASS1, 2, and 3 (the corresponding light curves are not shown).
Current usage metrics show cumulative count of Article Views (full-text article views including HTML views, PDF and ePub downloads, according to the available data) and Abstracts Views on Vision4Press platform.
Data correspond to usage on the plateform after 2015. The current usage metrics is available 48-96 hours after online publication and is updated daily on week days.
Initial download of the metrics may take a while.