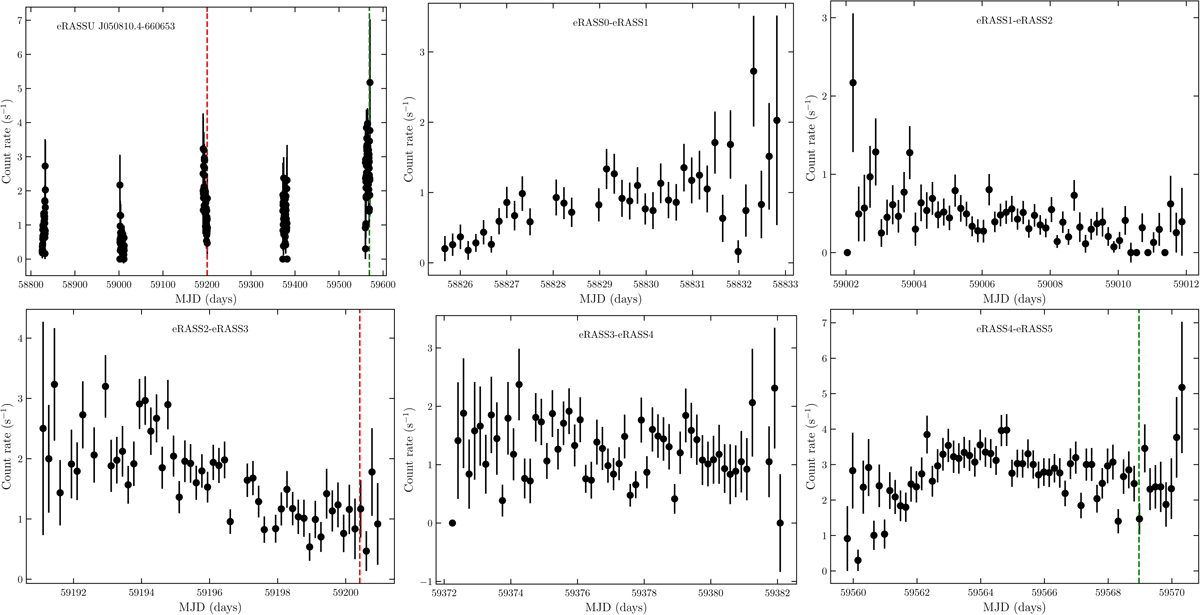
Fig. A.1.
Download original image
eROSITA light curve of eRASSU J050810.4–660653 in the energy band 0.2–8 keV, combining data from all TMs. Until the end of 2021, eROSITA scanned the source during five epochs (upper left). The first scans were performed during a test phase (named eRASS0) before the official start of the all-sky survey (MJD 58828) with eRASS1 and then around the formal transitions of eRASS1-eRASS2, eRASS2-eRASS3, eRASS3-eRASS4, and eRASS4-eRASS5. The red and green dashed lines mark the beginning of the XMM-Newton and NuSTAR observations (Salganik et al. 2022; Haberl et al. 2021), respectively.
Current usage metrics show cumulative count of Article Views (full-text article views including HTML views, PDF and ePub downloads, according to the available data) and Abstracts Views on Vision4Press platform.
Data correspond to usage on the plateform after 2015. The current usage metrics is available 48-96 hours after online publication and is updated daily on week days.
Initial download of the metrics may take a while.