Open Access
Fig. 8
Download original image
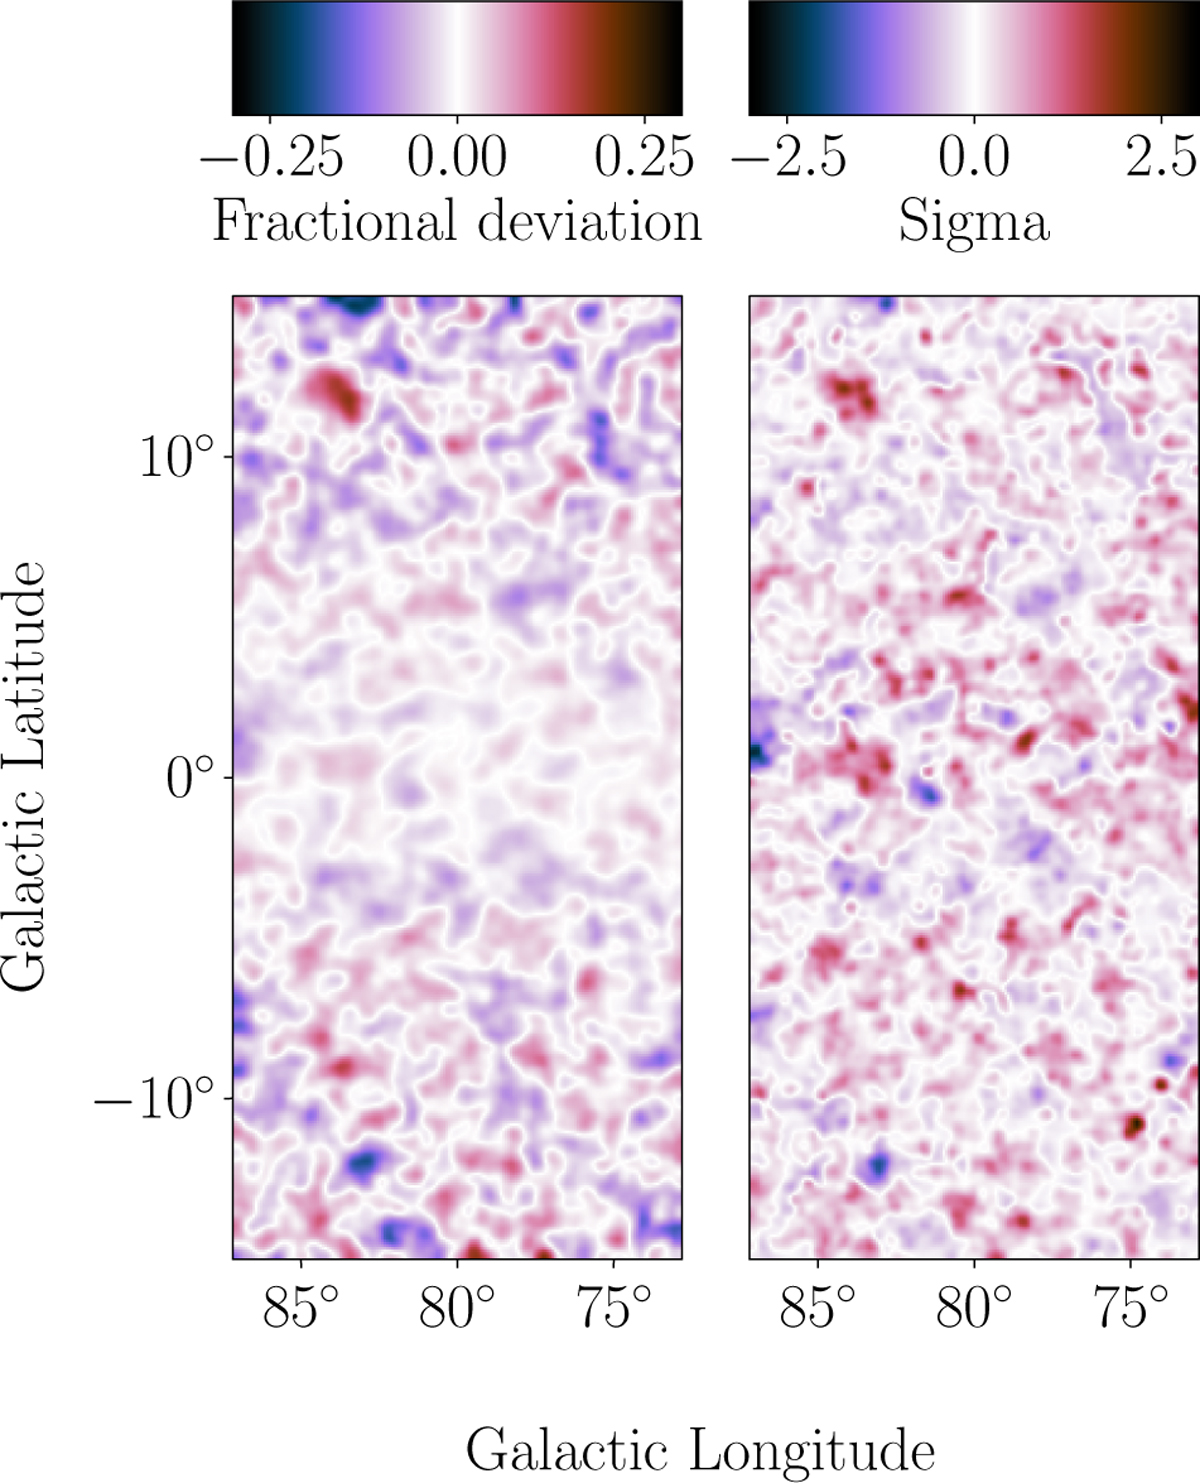
Final deviation maps for the best-fit model over the entire energy range, on the left as fractional deviation, and on the right using the PS map. The bin size is 0.1° and the size of the smoothing kernel 0.13°.
Current usage metrics show cumulative count of Article Views (full-text article views including HTML views, PDF and ePub downloads, according to the available data) and Abstracts Views on Vision4Press platform.
Data correspond to usage on the plateform after 2015. The current usage metrics is available 48-96 hours after online publication and is updated daily on week days.
Initial download of the metrics may take a while.