Fig. 7
Download original image
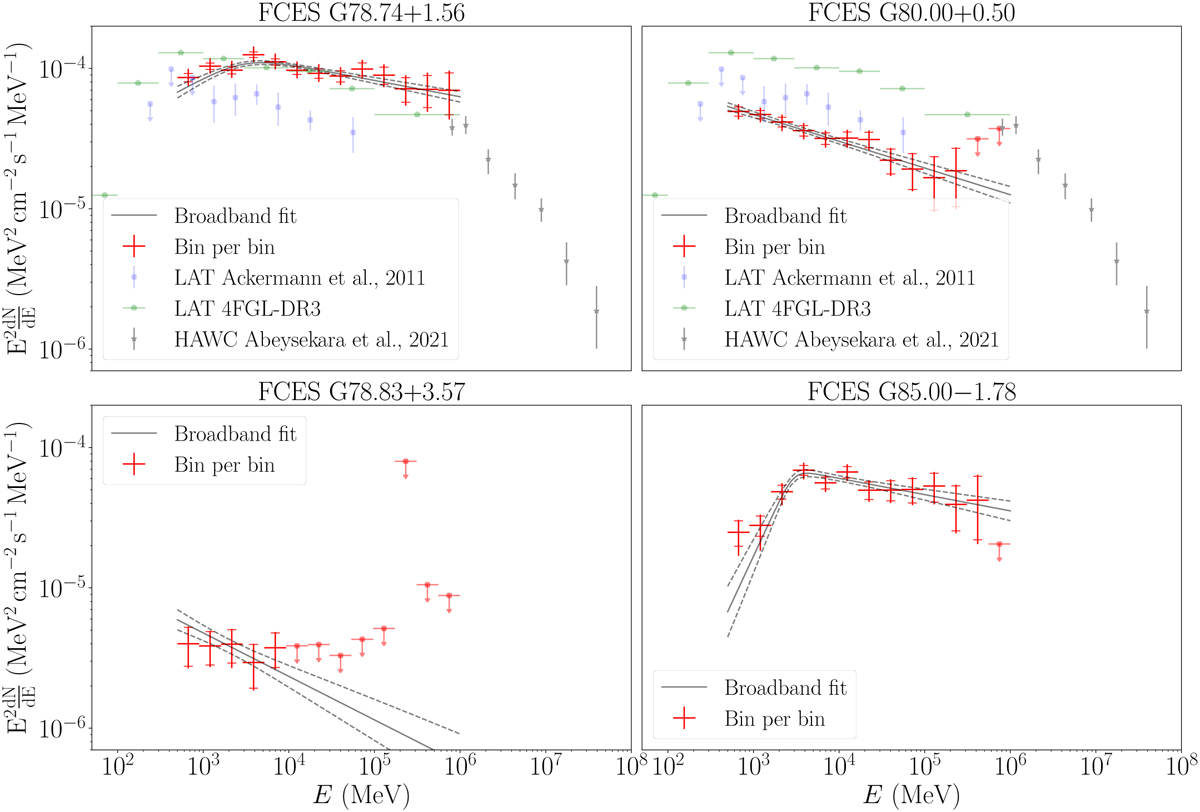
Spectral energy distribution of the four extended components studied. In the top panel, we show for reference earlier determinations of the cocoon spectrum. The statistical uncertainties are displayed within the error caps and the full error bar is the quadratic sum of the statistical uncertainties, the uncertainties related to the different spin temperatures, and the uncertainties related to the effective area of the telescope.
Current usage metrics show cumulative count of Article Views (full-text article views including HTML views, PDF and ePub downloads, according to the available data) and Abstracts Views on Vision4Press platform.
Data correspond to usage on the plateform after 2015. The current usage metrics is available 48-96 hours after online publication and is updated daily on week days.
Initial download of the metrics may take a while.