Fig. 6
Download original image
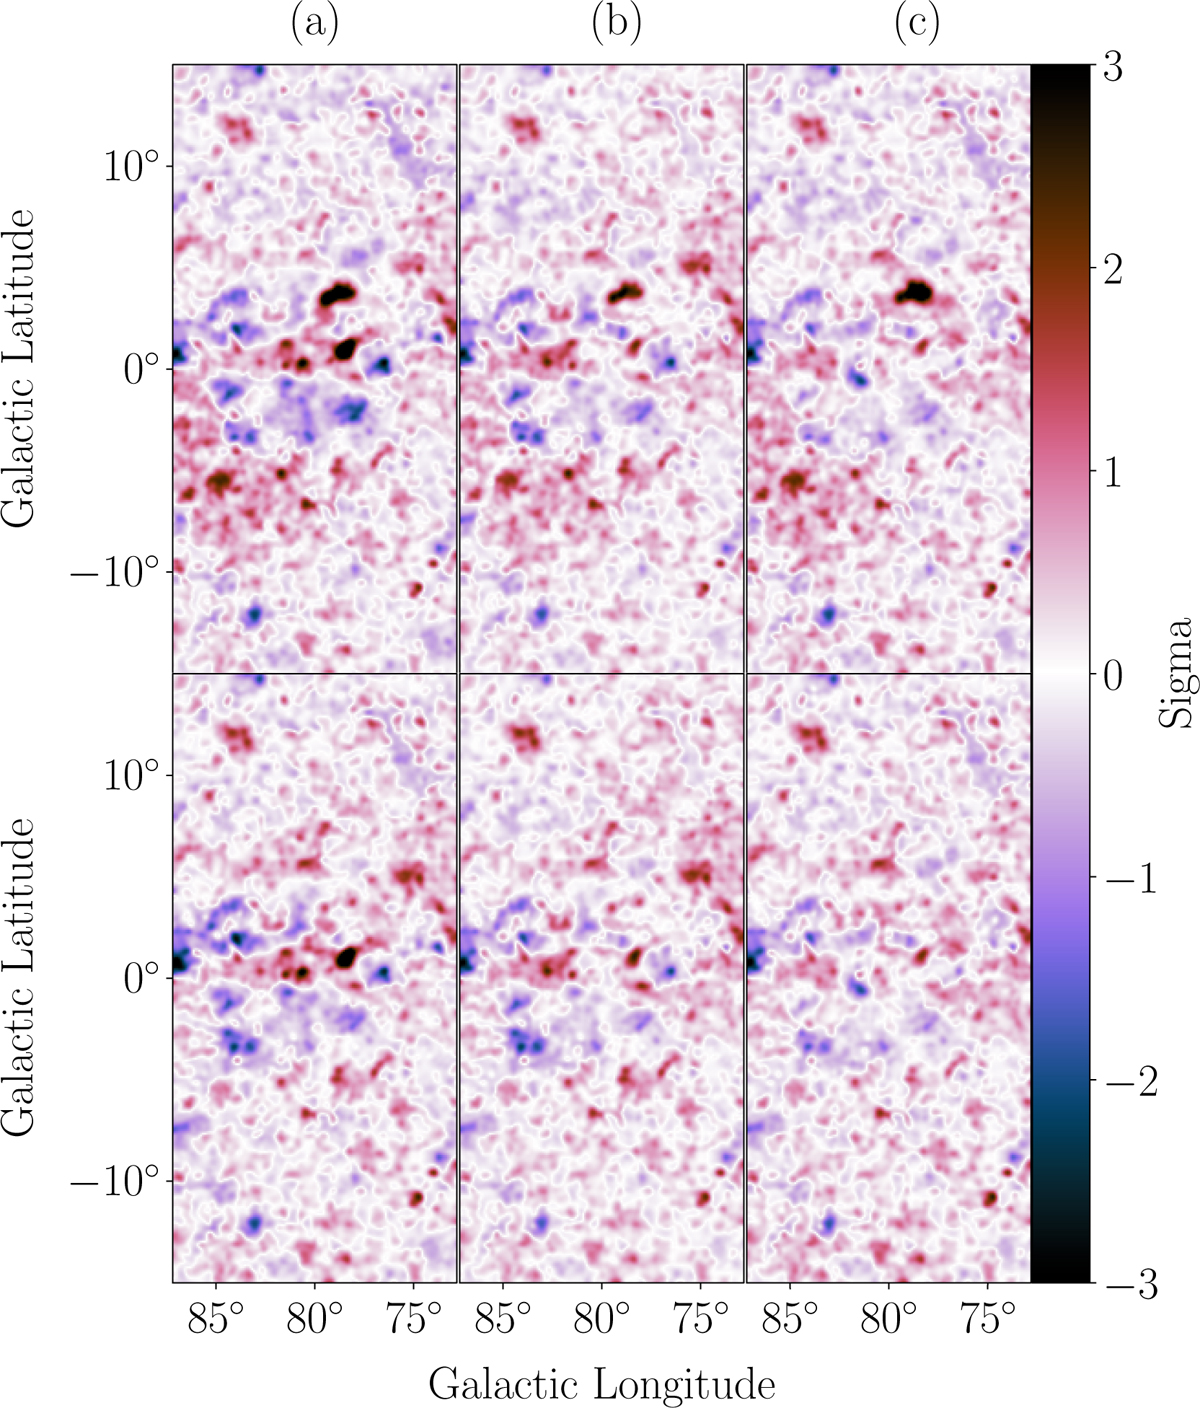
PS maps for different models considered in the morphological analysis. On the top panels we can see the PS maps for different morphological models: (a) one extended Gaussian, (b) one extended Gaussian plus two smaller Gaussians at the peaks of the ionised gas column density distribution, (c) one extended Gaussian plus the ionised gas template. On the bottom panels, we can see the PS maps for the same models with the addition of two Gaussians for the western and off-field excesses in the model (ultimately labelled FCES G78.83+3.57 and FCES G85.00−1.78). The bin size is 0.1° and the maps were smoothed for display with a kernel of size 0.13°.
Current usage metrics show cumulative count of Article Views (full-text article views including HTML views, PDF and ePub downloads, according to the available data) and Abstracts Views on Vision4Press platform.
Data correspond to usage on the plateform after 2015. The current usage metrics is available 48-96 hours after online publication and is updated daily on week days.
Initial download of the metrics may take a while.