Fig. 5
Download original image
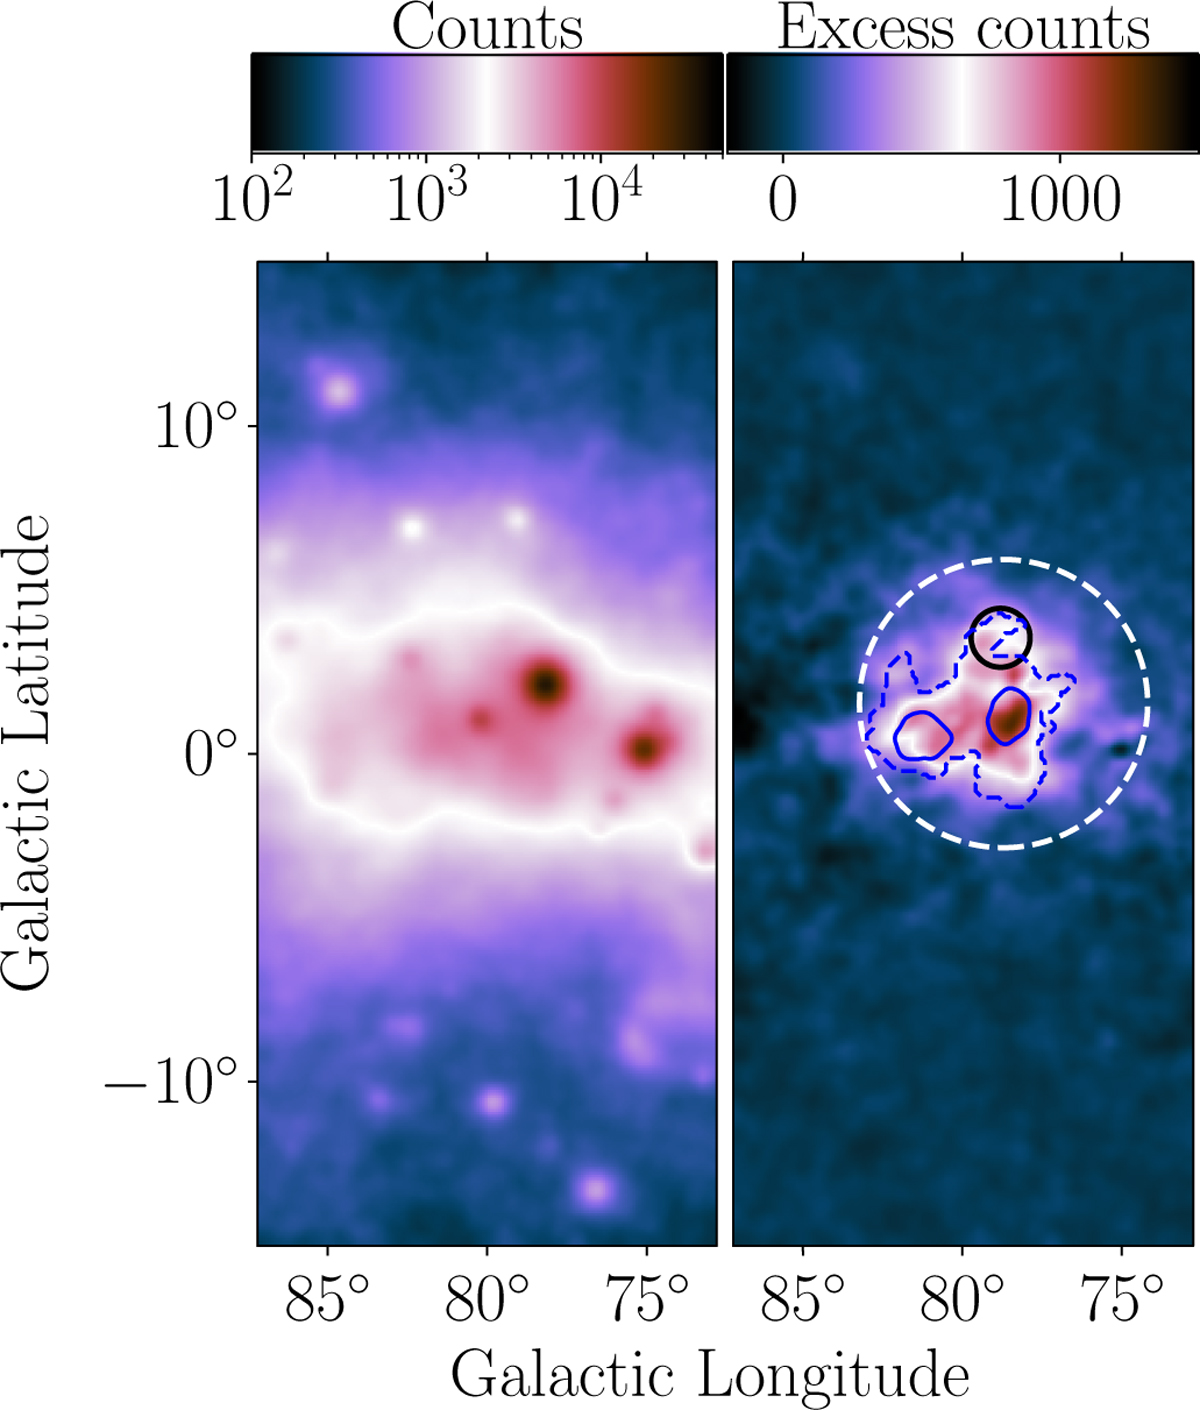
Map of data counts in the full 0.5 GeV–1 TeV energy range (left) and map of excess counts obtained by subtracting from the data counts the best-fit model presented in Sect. 3.6 except for the components associated to the cocoon, namely FCES G78.74+1.56, FCES G80.00+0.50, and FCES G78.83+3.57 (right). The dashed contours correspond to the 8 µm emission from MSX data at 1.85 × 10⁻⁶ W m−2 sr−1. The contours correspond to the column density of the ionised gas template at 3.5 × 10²¹ H cm−2. The circle and the dashed circle correspond to the position and r68 of FCES G78.83+3.57 and FCES G78.74+1.56 respectively.
Current usage metrics show cumulative count of Article Views (full-text article views including HTML views, PDF and ePub downloads, according to the available data) and Abstracts Views on Vision4Press platform.
Data correspond to usage on the plateform after 2015. The current usage metrics is available 48-96 hours after online publication and is updated daily on week days.
Initial download of the metrics may take a while.