Fig. 18
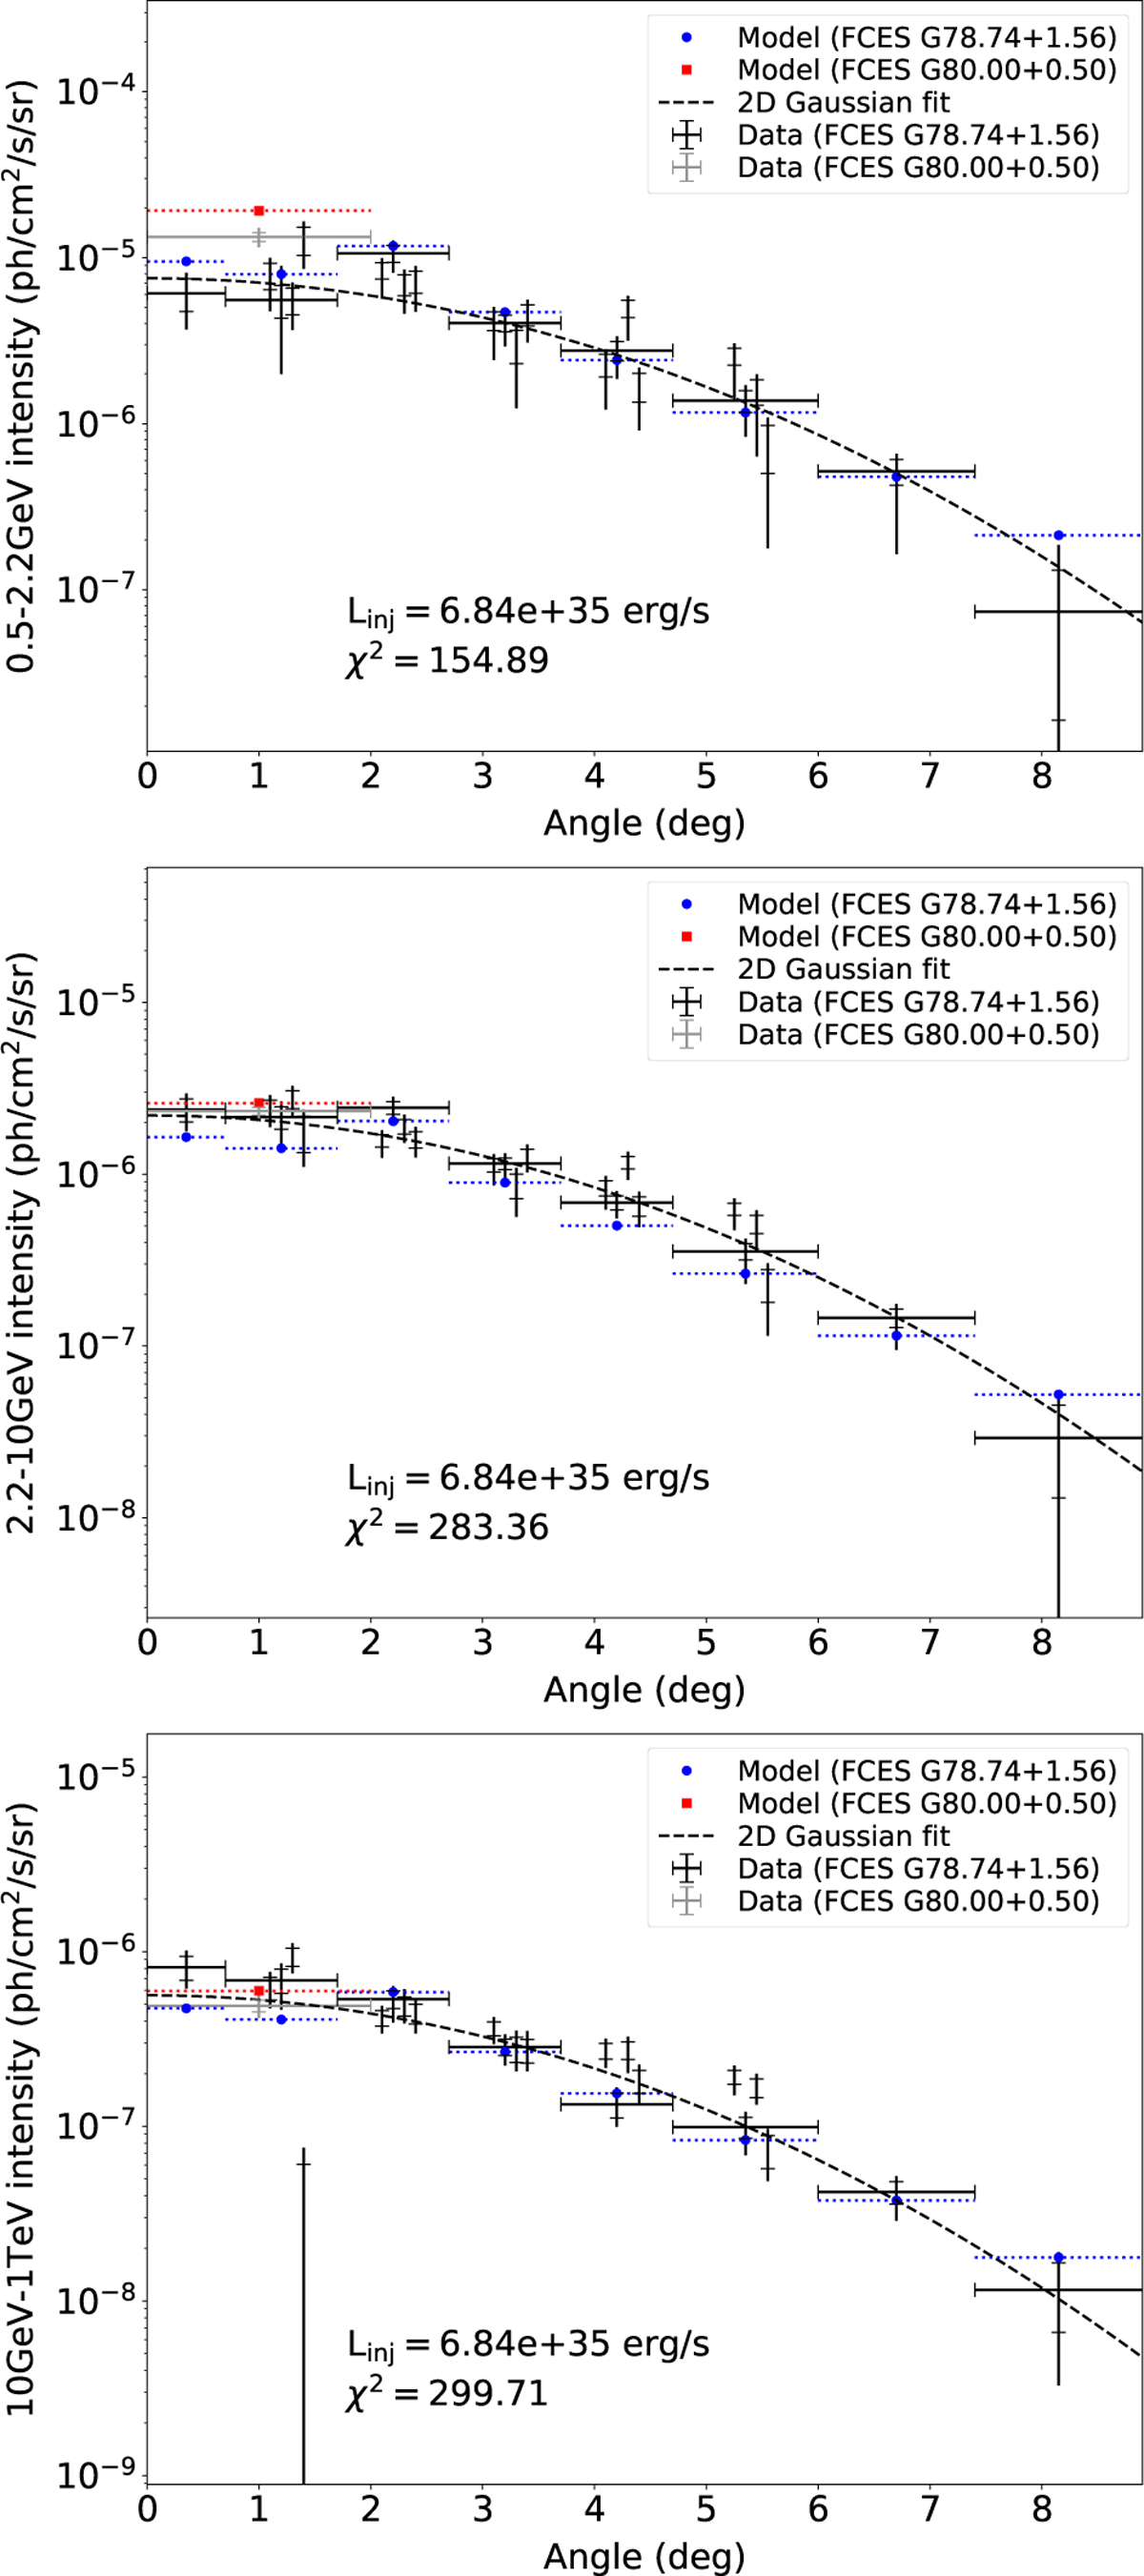
Download original image
Intensity radial profiles in three different gamma-ray energy bands for the FCES G78.74+1.56 and FCES G80.00+0.50 emission components, compared to predictions for model setup L1. The intensity distribution corresponding to the best-fit two-dimensional Gaussian model is displayed for comparison as a dotted line. The χ2 value correspond to the deviation from the 2D Gaussian fit.
Current usage metrics show cumulative count of Article Views (full-text article views including HTML views, PDF and ePub downloads, according to the available data) and Abstracts Views on Vision4Press platform.
Data correspond to usage on the plateform after 2015. The current usage metrics is available 48-96 hours after online publication and is updated daily on week days.
Initial download of the metrics may take a while.