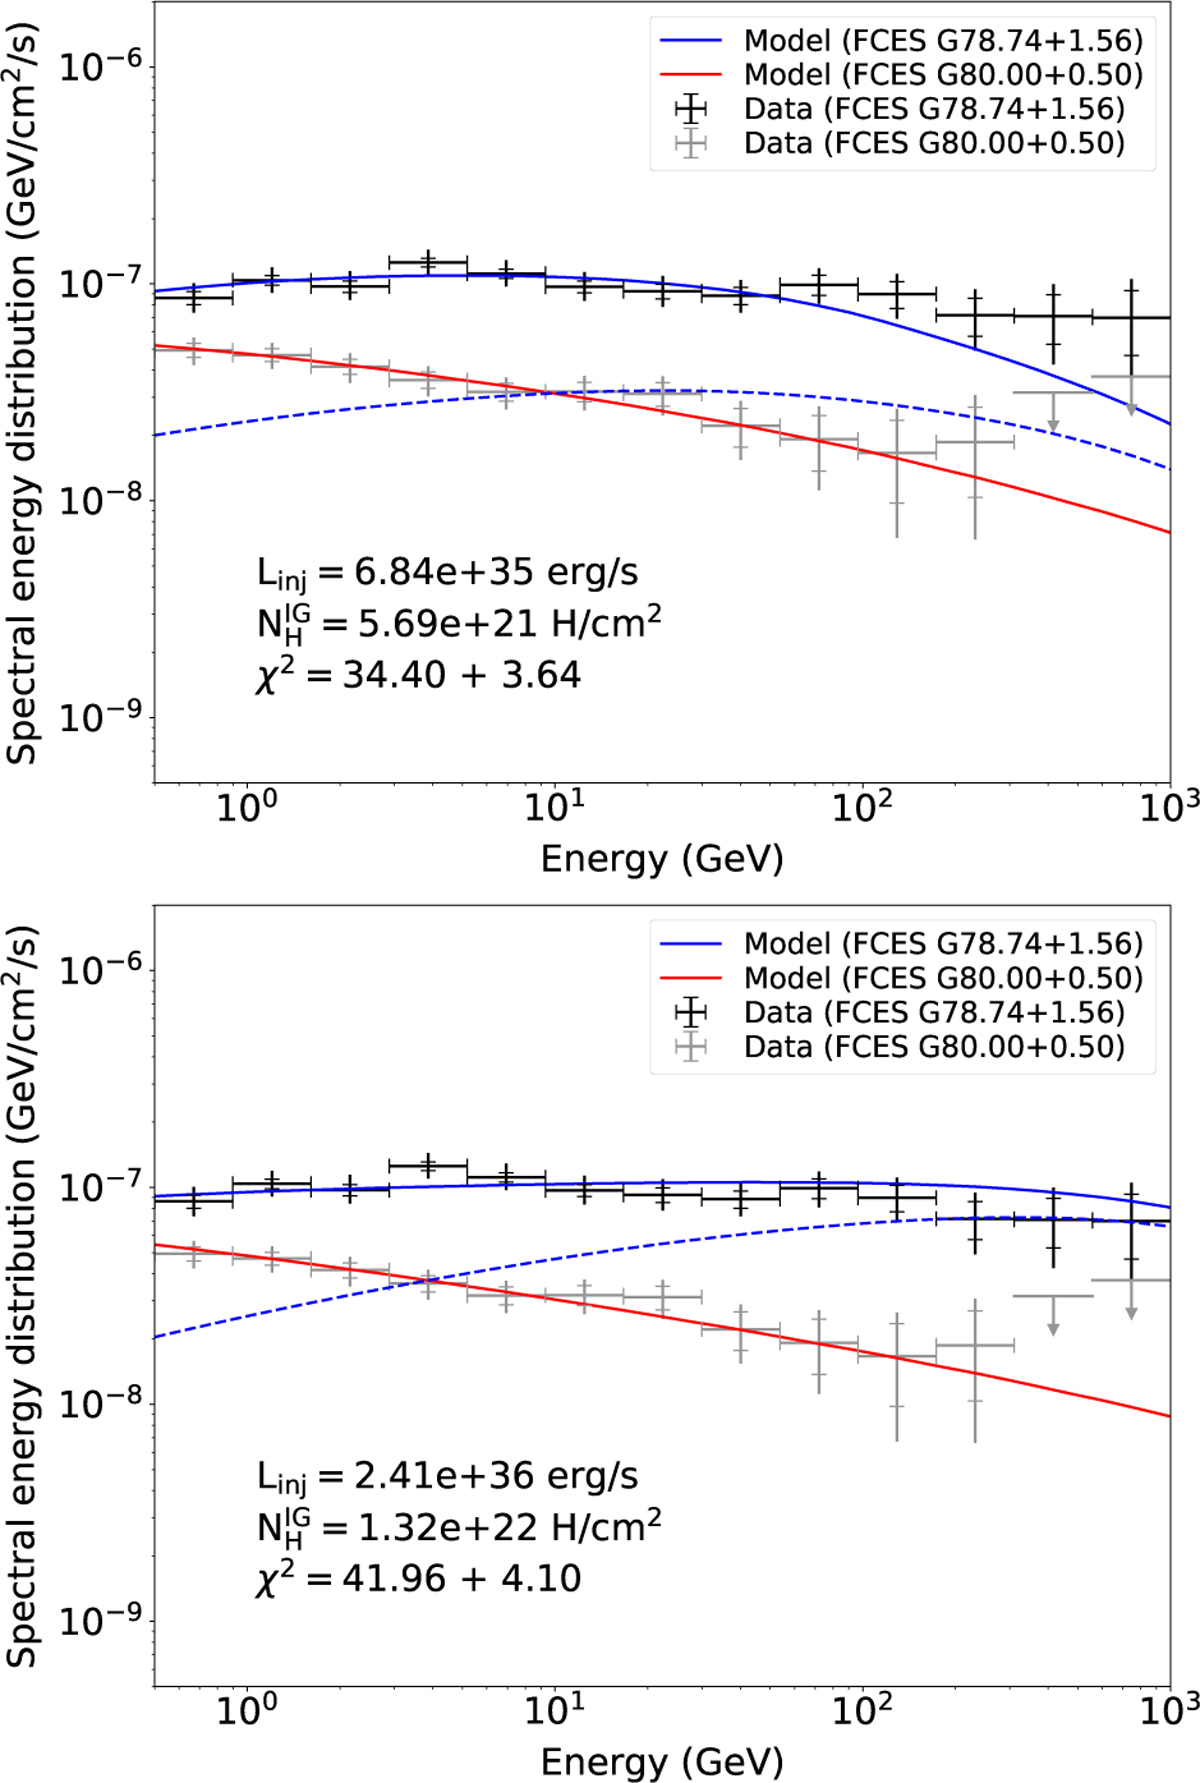
Fig. 17

Download original image
Fitted model spectra for the FCES G78.74+1.56 and FCES G80.00+0.50 emission components, for model setup L1 (top) and L2 (bottom). A fit of the model to the spectrum of FCES G78.74+1.56 is done first, with the injection luminosity as fitting parameter, followed by a second fit of the Bremsstrahlung emission only to the spectrum of FCES G80.00+0.50, with ionised gas column density as fitting parameter. This last fit does not include a contribution to the emission from a background population of CRs (see text). The dashed blue line is the inverse-Compton contribution in the emission model for FCES G78.74+1.56. The first χ2 corresponds to the fit to FCES G78.74+1.56 and the second one to FCES G80.00+0.50.
Current usage metrics show cumulative count of Article Views (full-text article views including HTML views, PDF and ePub downloads, according to the available data) and Abstracts Views on Vision4Press platform.
Data correspond to usage on the plateform after 2015. The current usage metrics is available 48-96 hours after online publication and is updated daily on week days.
Initial download of the metrics may take a while.


