Fig. 16
Download original image
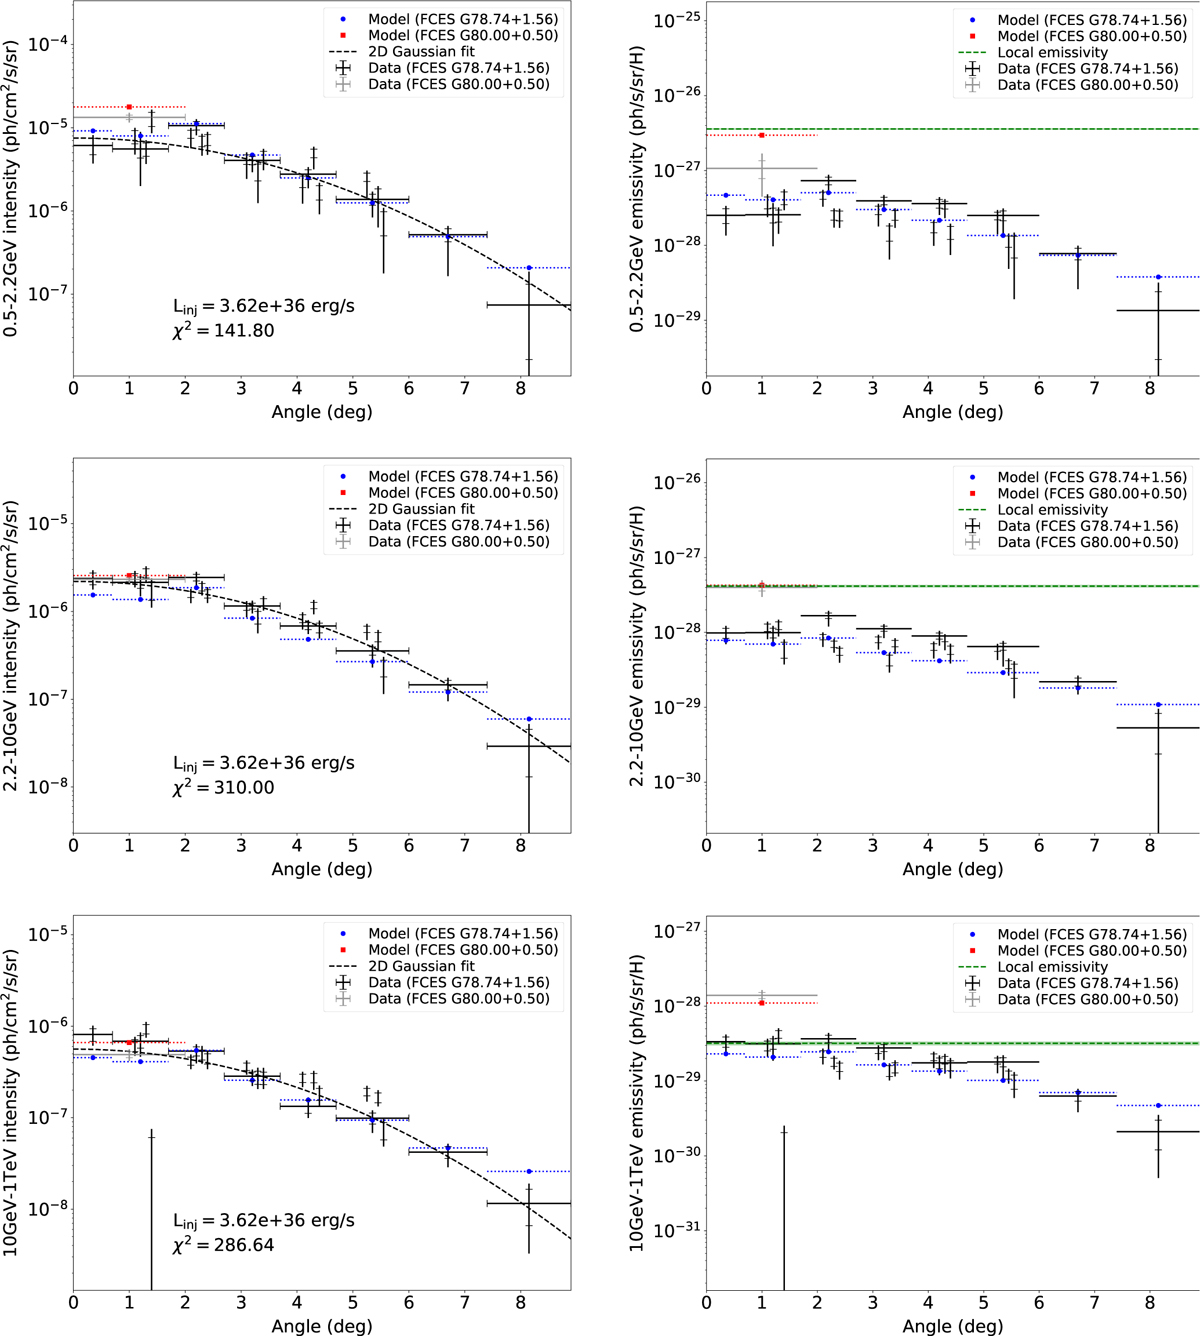
Intensity and emissivity radial profiles in three different gamma-ray energy bands for the FCES G78.74+1.56 and FCES G80.00+0.50 emission components, compared to predictions for model setup H1. In the intensity plots, the intensity distribution corresponding to the best-fit two-dimensional Gaussian model is displayed for comparison as a dotted line. In the emissivity plots, the local emissivity and its uncertainty in each energy range are displayed for comparison as a dotted line and a shaded band. The data points correspond to a decomposition of the emission into the ionised gas template, a central disk, two outer rings, and five intermediate rings split azimuthally into four segments. For the latter, we displayed the corresponding angular range only for one segment in each ring and introduced a small horizontal shift of the others, for readability. The full extent of the error bars corresponds to the quadratic sum of the statistical and systematic uncertainties, while the caps mark the contribution of the statistical uncertainty only.
Current usage metrics show cumulative count of Article Views (full-text article views including HTML views, PDF and ePub downloads, according to the available data) and Abstracts Views on Vision4Press platform.
Data correspond to usage on the plateform after 2015. The current usage metrics is available 48-96 hours after online publication and is updated daily on week days.
Initial download of the metrics may take a while.