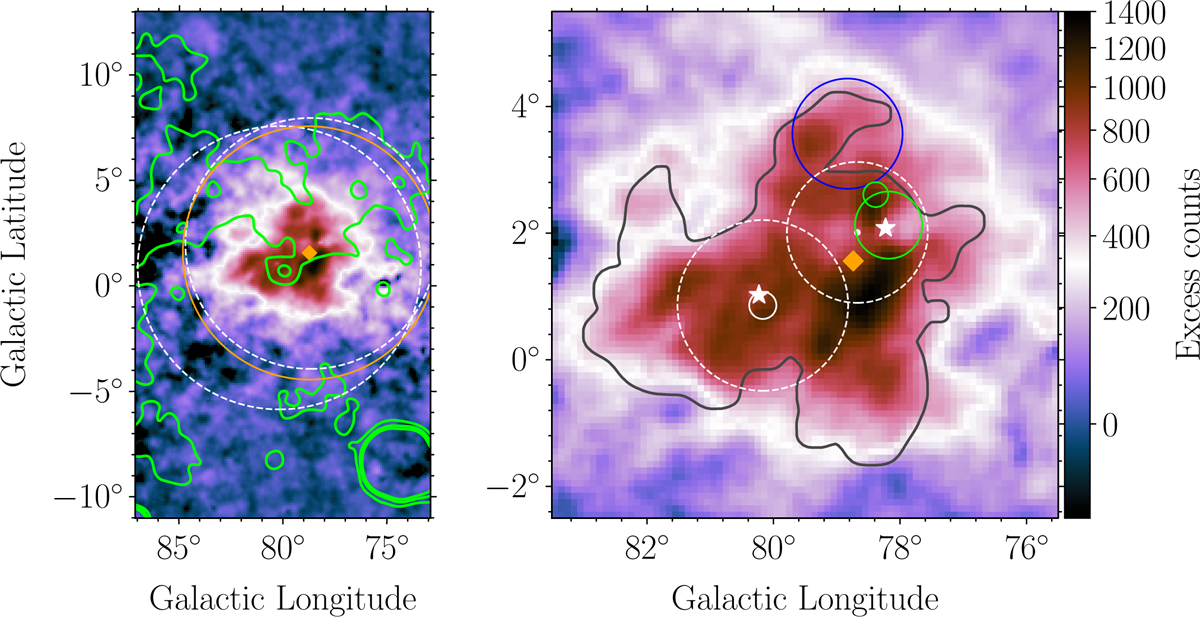
Fig. 12
Download original image
Excess counts corresponding to the three gamma-ray sources associated or potentially related to the cocoon, namely FCES G78.74+1.56, FCES G80.00+0.50, and FCES G78.83+3.57 (zoomed in from the left panel in Fig. 5). Left: extended region. Green contours correspond to the X-ray emission from the ROSAT all-sky survey in the 0.4–2.4 keV band. The orange circle shows the outer radius of the third to last annulus included in the analysis. The dashed circles show the estimated sizes of the wind bubbles for Cyg OB2 (lower left) and NGC 6910 (upper right). See text for details. Right: zoom in the central region. Black contours correspond to the 8 µm emission from MSX data at 1.85 × 10⁻⁶ W m−2 sr−1. The stars show the positions of PSR J2032+4127 (lower left) and PSR J2021 +4026 (upper right). The green circles show the radius/68% containment radius of the two emission components associated with the γ Cygni SNR (subtracted from the map, see Sect. 3.2 for details). The blue circle shows the 68% containment radius of FCES G78.83+3.57. The continuous circles show the 50% containment radius for members of the Cyg OB2 association (Berlanas et al. 2019) and of the NGC 6910 cluster (Cantat-Gaudin et al. 2020, NGC 6910 has a 50% containment radius of 8.9′′ which appears as a dot on this image). The dashed circles show the estimated sizes of the cluster wind termination shock for Cyg OB2 (lower-left) and NGC 6910 (upper right). In both panels the orange diamond shows the centre of FCES G78.74+1.56.
Current usage metrics show cumulative count of Article Views (full-text article views including HTML views, PDF and ePub downloads, according to the available data) and Abstracts Views on Vision4Press platform.
Data correspond to usage on the plateform after 2015. The current usage metrics is available 48-96 hours after online publication and is updated daily on week days.
Initial download of the metrics may take a while.