Fig. 11
Download original image
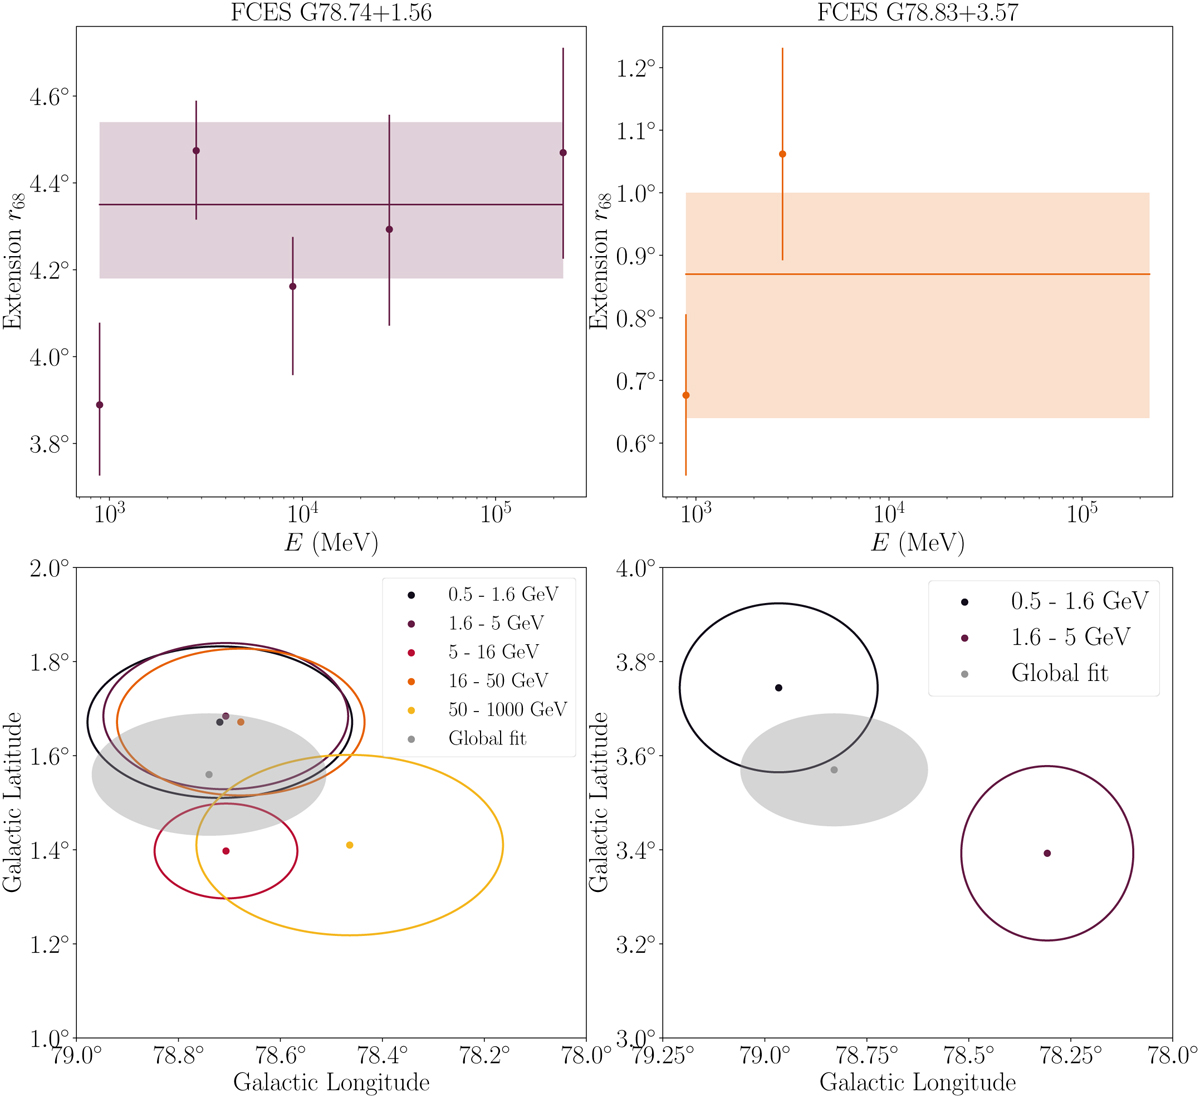
Extension (top) and position (bottom) for FCES G78.74+1.56 (left) and FCES G78.83+3.57 (right) as a function of energy. In the top panels the bands show the values in the global fit over the entire energy range. In the bottom panels the grey areas show the results in the entire energy range. All uncertainties are provided at 1σ level.
Current usage metrics show cumulative count of Article Views (full-text article views including HTML views, PDF and ePub downloads, according to the available data) and Abstracts Views on Vision4Press platform.
Data correspond to usage on the plateform after 2015. The current usage metrics is available 48-96 hours after online publication and is updated daily on week days.
Initial download of the metrics may take a while.