Fig. 9
Download original image
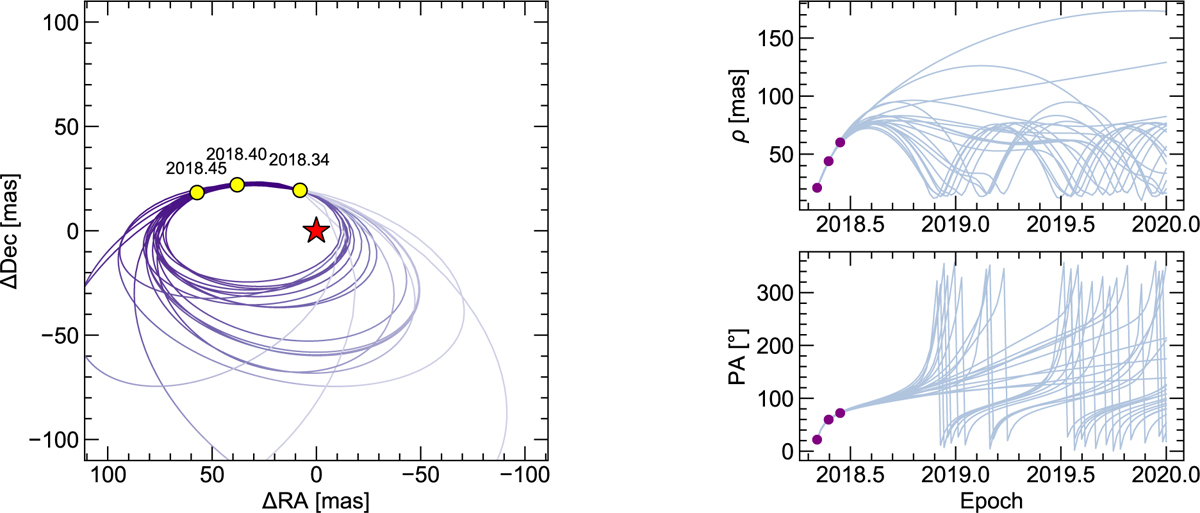
20 example fitted orbits (colored lines), randomly sampled from the full population of fitted orbits. The orbits are generally significantly smaller and less eccentric than the input orbit, underlining the fact that the probed baseline is too short to determine exact parameters, although meaningful limits can be obtained (see text for details). Left: the orbital fits in two dimensions. The red star symbol marks the location of the star, and the yellow points mark the locations of the comet at three measured epochs. Upper right: separation as function of time. Upper left: position angle as function of time. Purple dots mark the location of the comet at the respective epochs.
Current usage metrics show cumulative count of Article Views (full-text article views including HTML views, PDF and ePub downloads, according to the available data) and Abstracts Views on Vision4Press platform.
Data correspond to usage on the plateform after 2015. The current usage metrics is available 48-96 hours after online publication and is updated daily on week days.
Initial download of the metrics may take a while.