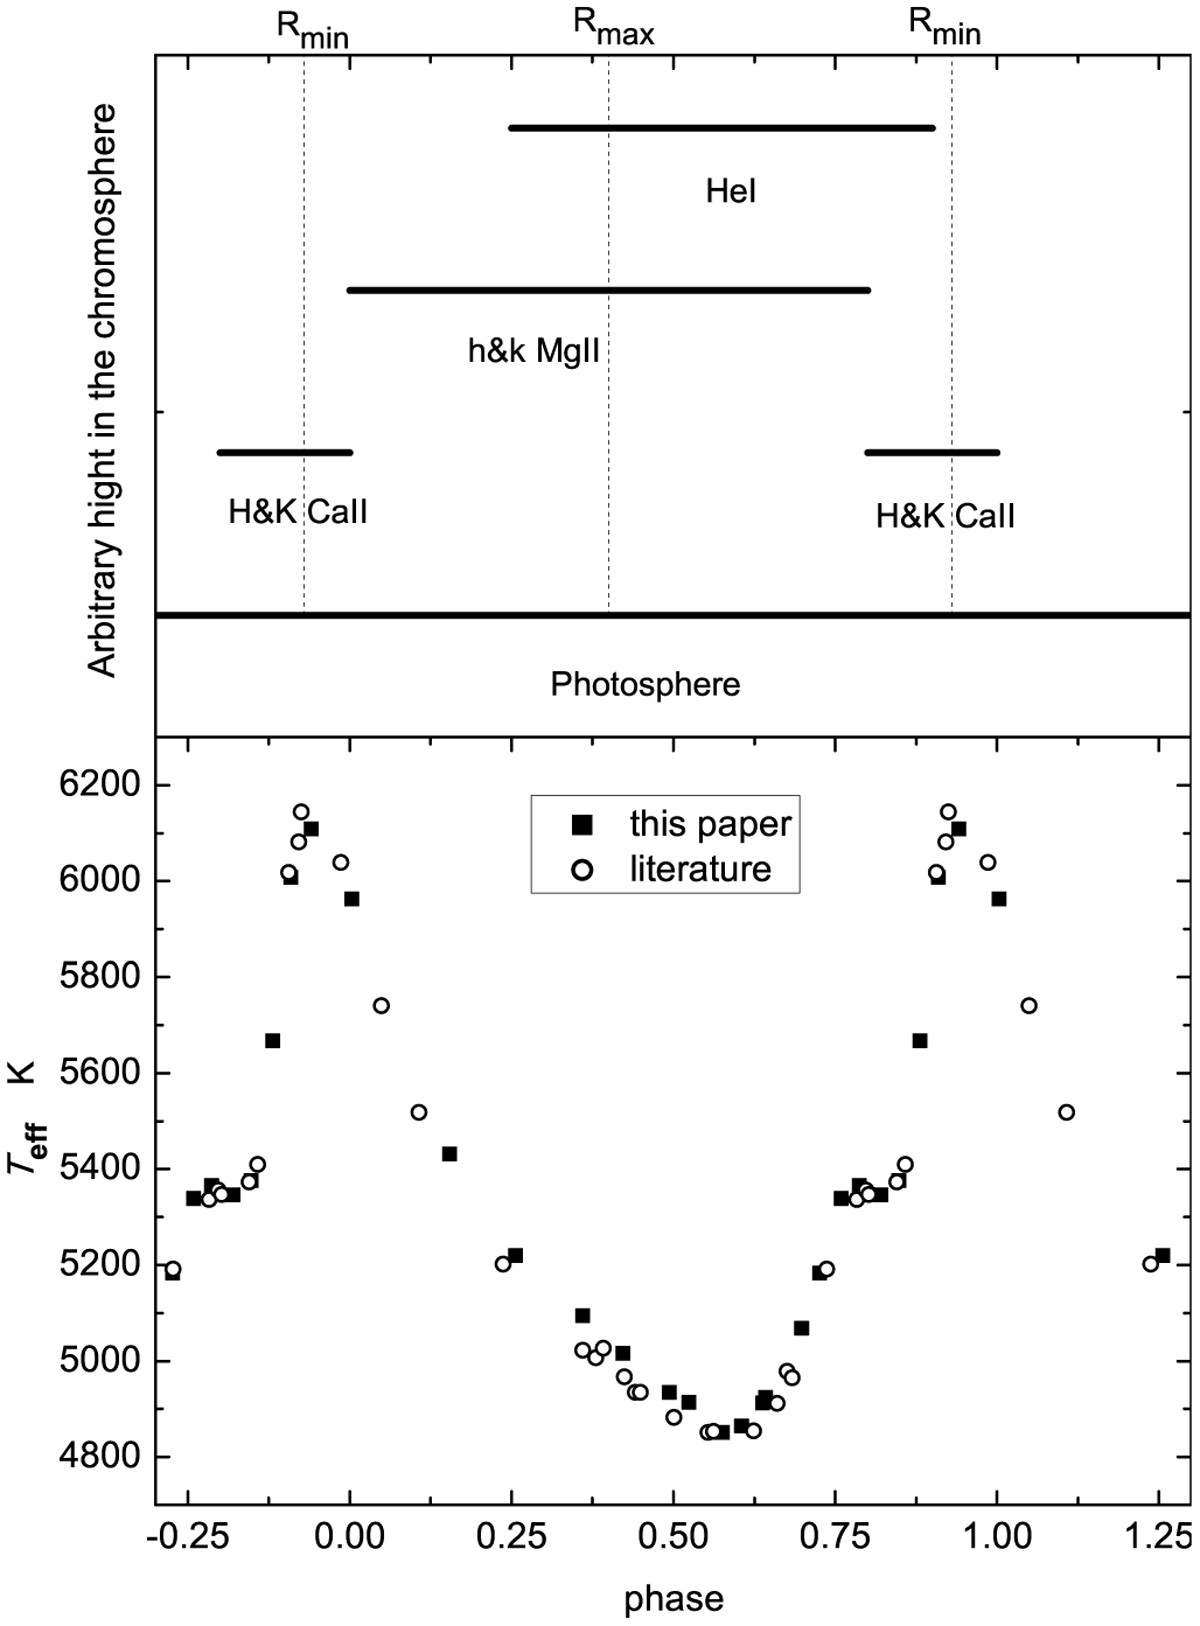
Fig. 4
Download original image
Schematic visualisation of the appearance and disappearance of chromosphere emissions in X Cyg, accompanied by a graph of the effective temperature variation of this star with the pulsation phase. Literature data on effective temperature are from Luck (2018). Vertical lines indicate the moments of the maximum and minimum radius of the star.
Current usage metrics show cumulative count of Article Views (full-text article views including HTML views, PDF and ePub downloads, according to the available data) and Abstracts Views on Vision4Press platform.
Data correspond to usage on the plateform after 2015. The current usage metrics is available 48-96 hours after online publication and is updated daily on week days.
Initial download of the metrics may take a while.