Fig. 9.
Download original image
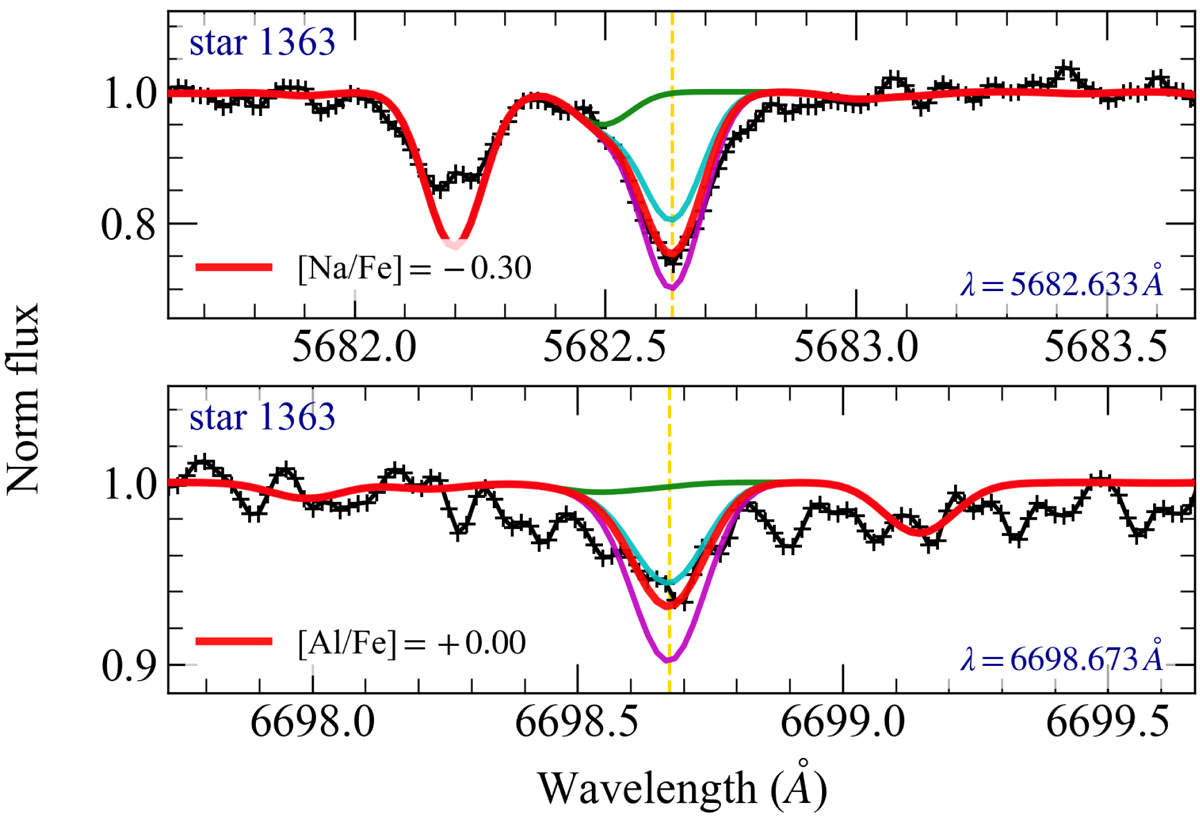
Example of line-profile fitting for star 1363. The upper panel shows the result for the Na I 5682.633 Å, and the bottom panel shows the fit for the Al I 6698.673 Å line. The black lines correspond to the observed spectra. The solid red line shows the best-fit solution as the median. For comparison purposes, we also plot the best-fit solution with a variation of ±0.15 (solid cyan and magenta lines) and the spectrum without the element abundance (green line).
Current usage metrics show cumulative count of Article Views (full-text article views including HTML views, PDF and ePub downloads, according to the available data) and Abstracts Views on Vision4Press platform.
Data correspond to usage on the plateform after 2015. The current usage metrics is available 48-96 hours after online publication and is updated daily on week days.
Initial download of the metrics may take a while.