Open Access
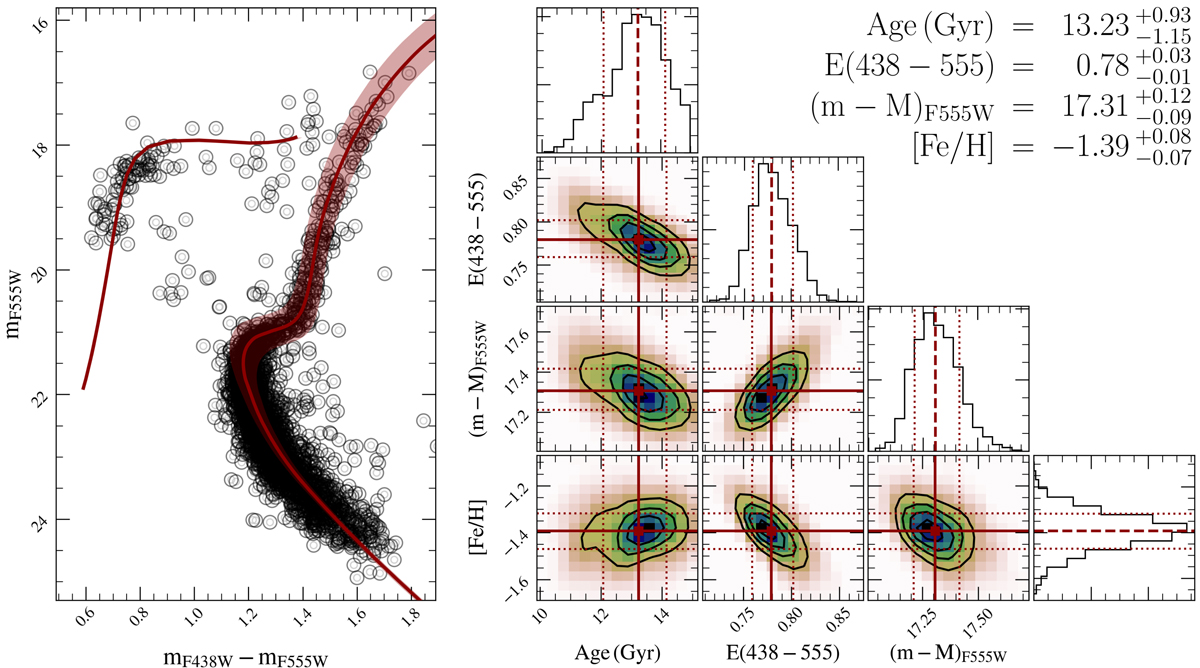
Fig. 6.
Download original image
Isochrone fitting for NGC 6355. The best solution is composed of the median values of the posterior distributions (solid dark red line), and the 1σ extrapolation is constructed from the 16th and 84th percentiles (shaded dark red region). The corner plot shows the correlations among the parameters.
Current usage metrics show cumulative count of Article Views (full-text article views including HTML views, PDF and ePub downloads, according to the available data) and Abstracts Views on Vision4Press platform.
Data correspond to usage on the plateform after 2015. The current usage metrics is available 48-96 hours after online publication and is updated daily on week days.
Initial download of the metrics may take a while.