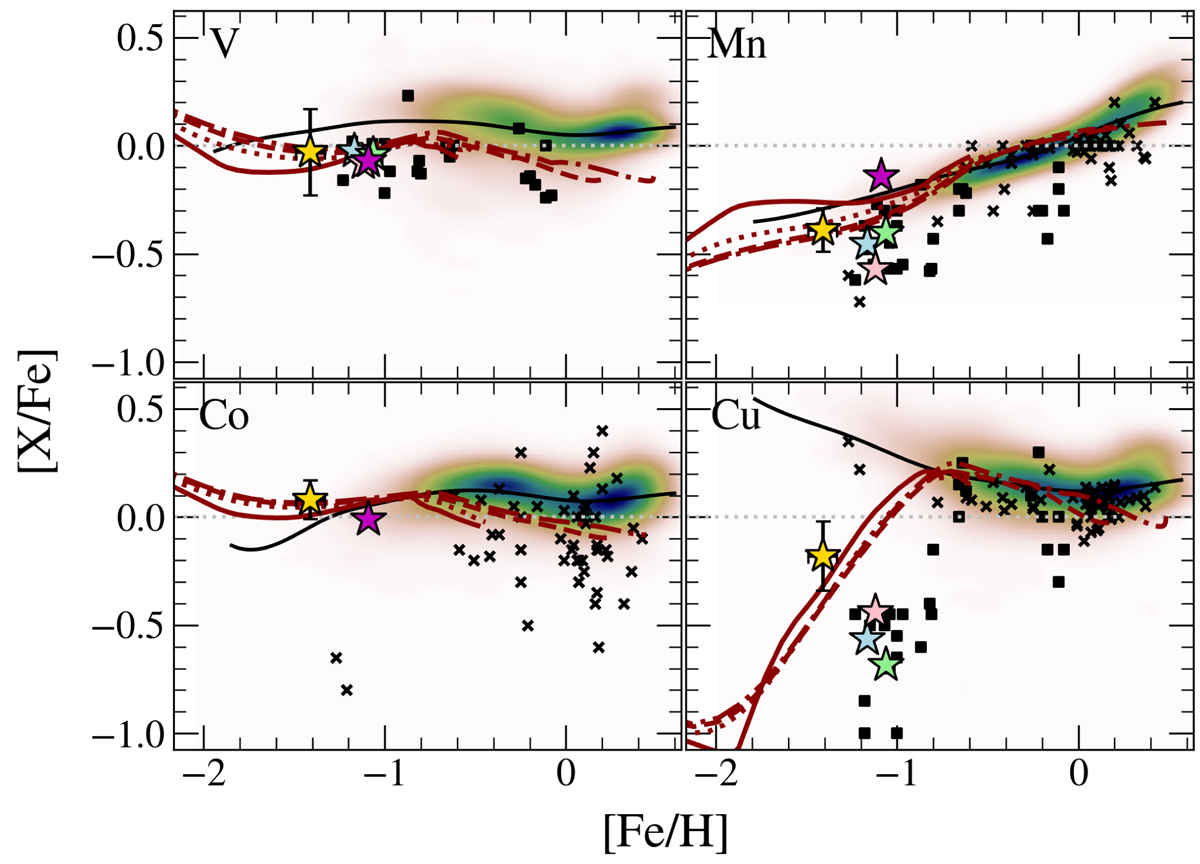
Fig. 21.
Download original image
Same as Fig. 19 for V, Mn, Co, and Cu. The black squares are bulge GC stars from Ernandes et al. (2018), and black crosses show bulge field stars from Ernandes et al. (2020). The chemodynamical evolution models are shown in different radius ranges: r < 0.5 kpc (dash-dotted line), 0.5 < r < 1 kpc (dashed line), 1 < r < 2 kpc (dotted line), and 2 < r < 3 kpc (solid line).
Current usage metrics show cumulative count of Article Views (full-text article views including HTML views, PDF and ePub downloads, according to the available data) and Abstracts Views on Vision4Press platform.
Data correspond to usage on the plateform after 2015. The current usage metrics is available 48-96 hours after online publication and is updated daily on week days.
Initial download of the metrics may take a while.