Fig. 19.
Download original image
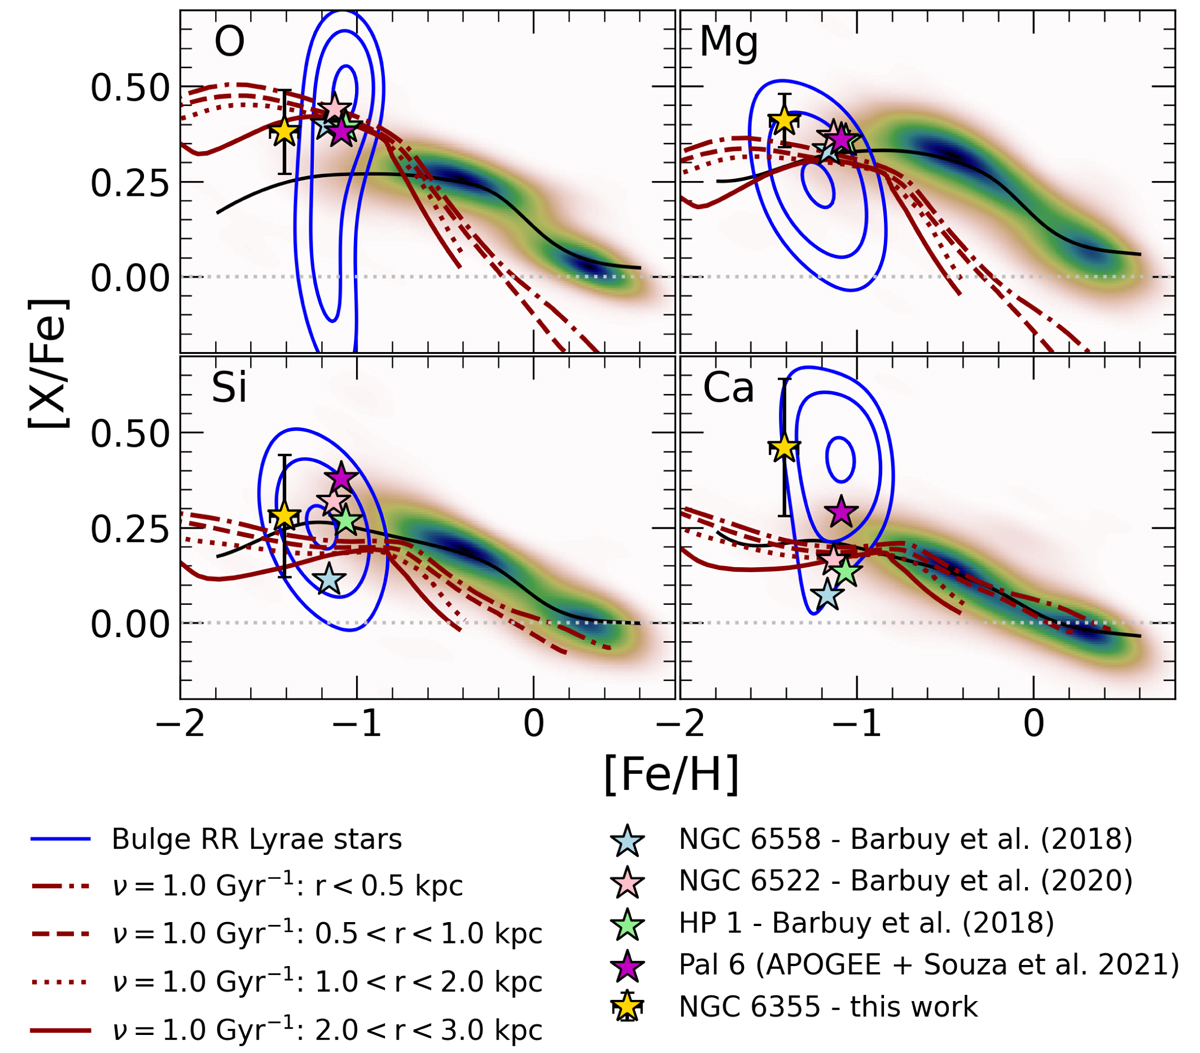
O, Mg, Si, and Ca abundance as a function of [Fe/H]. The KDE plot represents the RPM bulge selection from cell F, and the blue contours represent the RR Lyrae sample. The stars are abundances of bulge GCs: NGC 6558 (cyan), NGC 6522 (pink), HP1 (green), and Pal 6 (magenta). The golden star represents the mean abundance of NGC 6355. The chemodynamical evolution models are shown in different radii ranges: r < 0.5 kpc (dash-dotted line), 0.5 < r < 1 kpc (dashed line), 1 < r < 2 kpc (dotted line), and 2 < r < 3 kpc (solid line).
Current usage metrics show cumulative count of Article Views (full-text article views including HTML views, PDF and ePub downloads, according to the available data) and Abstracts Views on Vision4Press platform.
Data correspond to usage on the plateform after 2015. The current usage metrics is available 48-96 hours after online publication and is updated daily on week days.
Initial download of the metrics may take a while.