Fig. 18.
Download original image
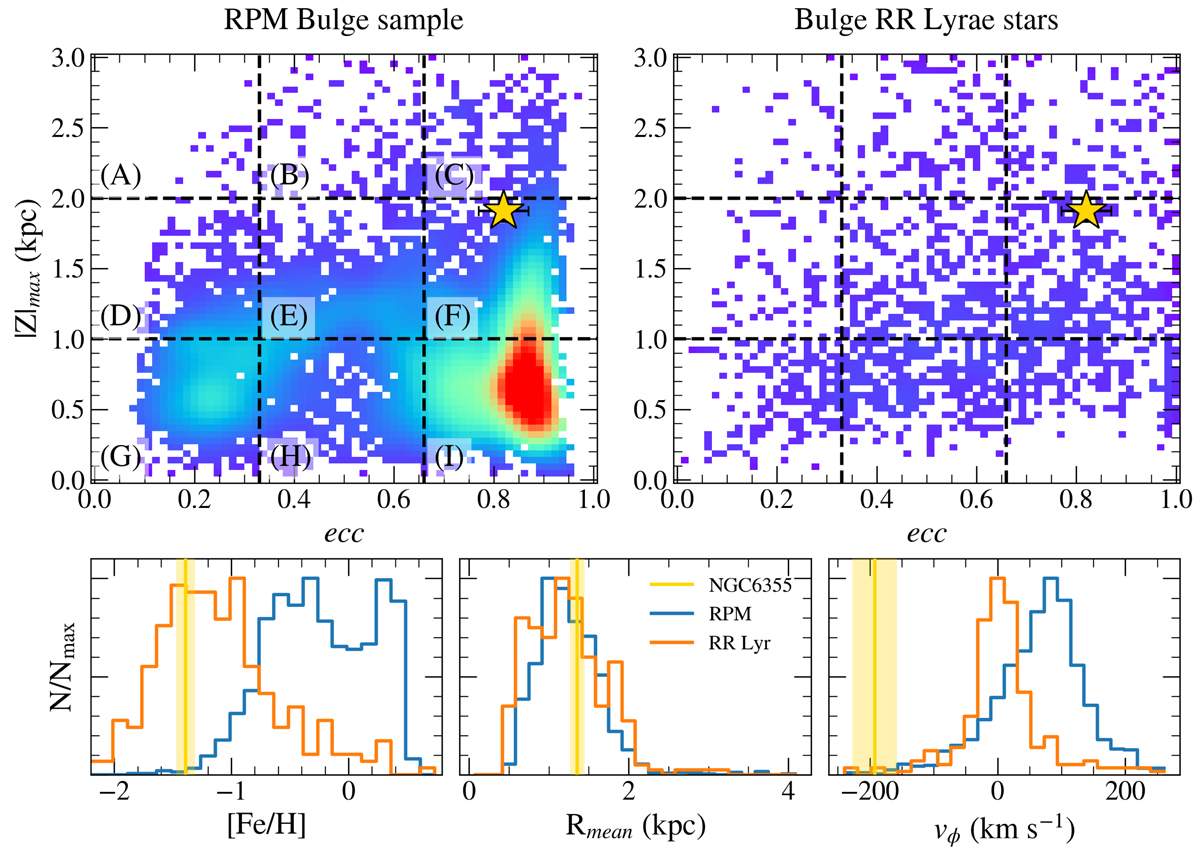
NGC6355 compared with the RPM bulge sample of Q21 (left panel) and Galactic bulge RR Lyrae population (right panel). Upper panels: |Z|max as a function of the eccentricity plane divided into nine frames defined by the letter close to the horizontal lines. The golden star represents the locus of NGC 6355. The bottom panels show the population density of [Fe/H], Rmean, and vϕ for cell F. The gold lines represent the position of NGC 6355 in each panel, and the shaded gold region shows the 1σ distribution.
Current usage metrics show cumulative count of Article Views (full-text article views including HTML views, PDF and ePub downloads, according to the available data) and Abstracts Views on Vision4Press platform.
Data correspond to usage on the plateform after 2015. The current usage metrics is available 48-96 hours after online publication and is updated daily on week days.
Initial download of the metrics may take a while.