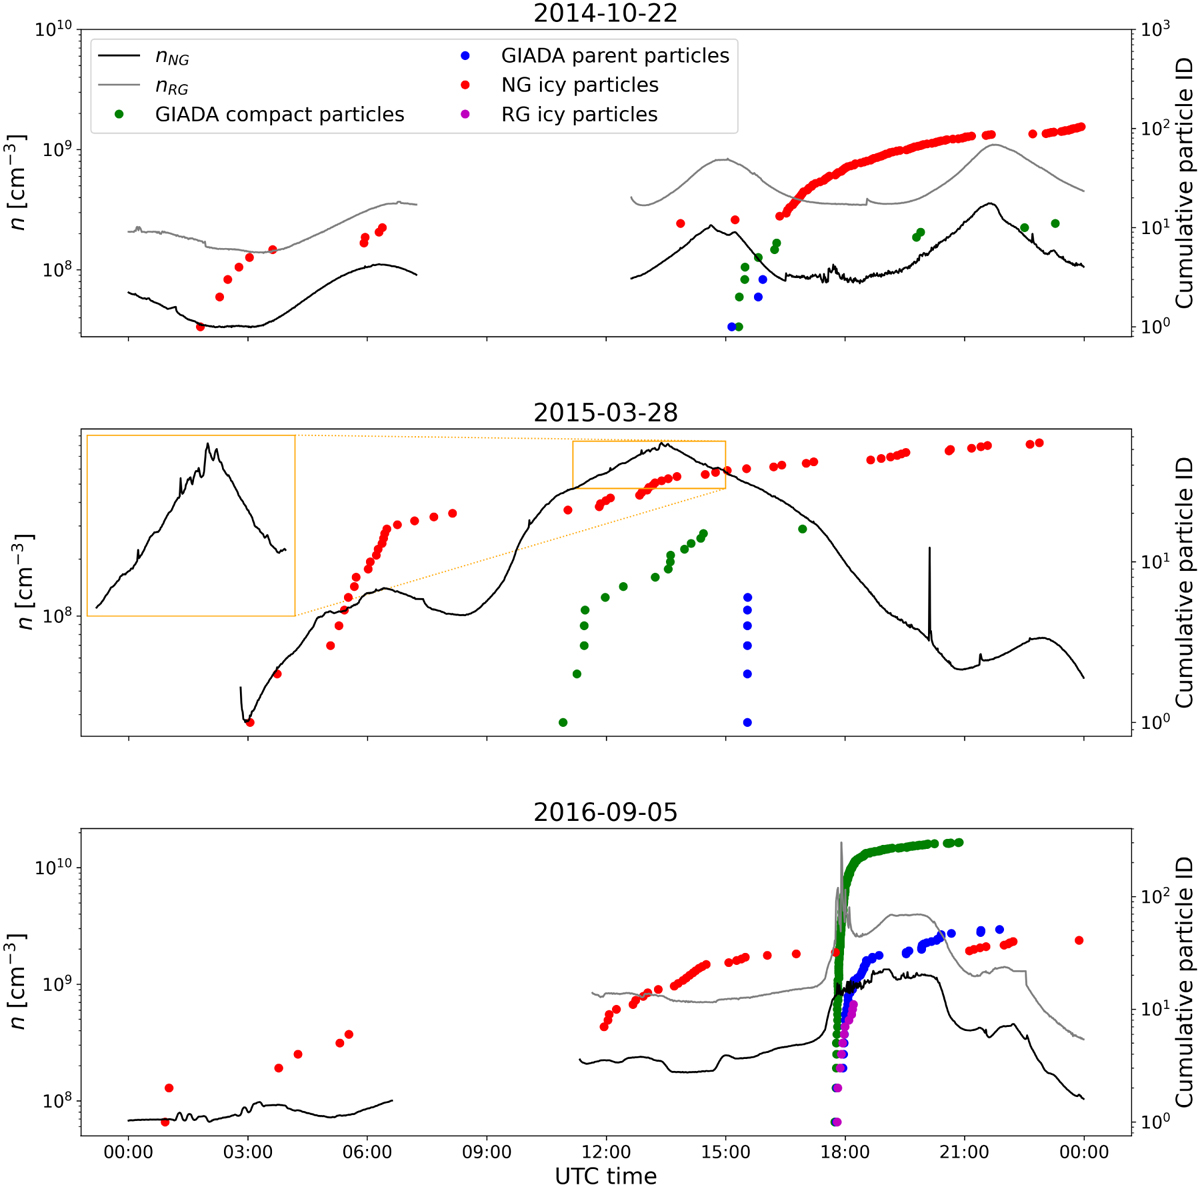
Fig. 1

Download original image
Comparison of COPS and GIADA measurements during 22 October 2014, 28 March 2015, and 5 September 2016. The plots display the gas density measured by the two COPS gauges (black curve for the NG, gray curve for the RG), the compact and parent particles detected by GIADA (green and blue dots, respectively), and the icy particles detected by the NG (red dots) and by the RG (magenta dots). Between 7:25 AM UTC and 12:15 PM UTC on 22 October 2014, and between 6:40 AM UTC and 11:00 AM UTC on 5 September 2016, there were orbital correction maneuvers during which COPS did not acquire any data. Large spikes in the NG density data, such as the one at 8:07 PM UTC on 28 March 2015, are associated with thruster operations (Pestoni et al. 2021b). There are also spikes in the RG data which happened following offset measurements (Pestoni et al. 2021a). The most evident one is at 6:33 PM UTC on 22 October 2014.
Current usage metrics show cumulative count of Article Views (full-text article views including HTML views, PDF and ePub downloads, according to the available data) and Abstracts Views on Vision4Press platform.
Data correspond to usage on the plateform after 2015. The current usage metrics is available 48-96 hours after online publication and is updated daily on week days.
Initial download of the metrics may take a while.


