Fig. 8.
Download original image
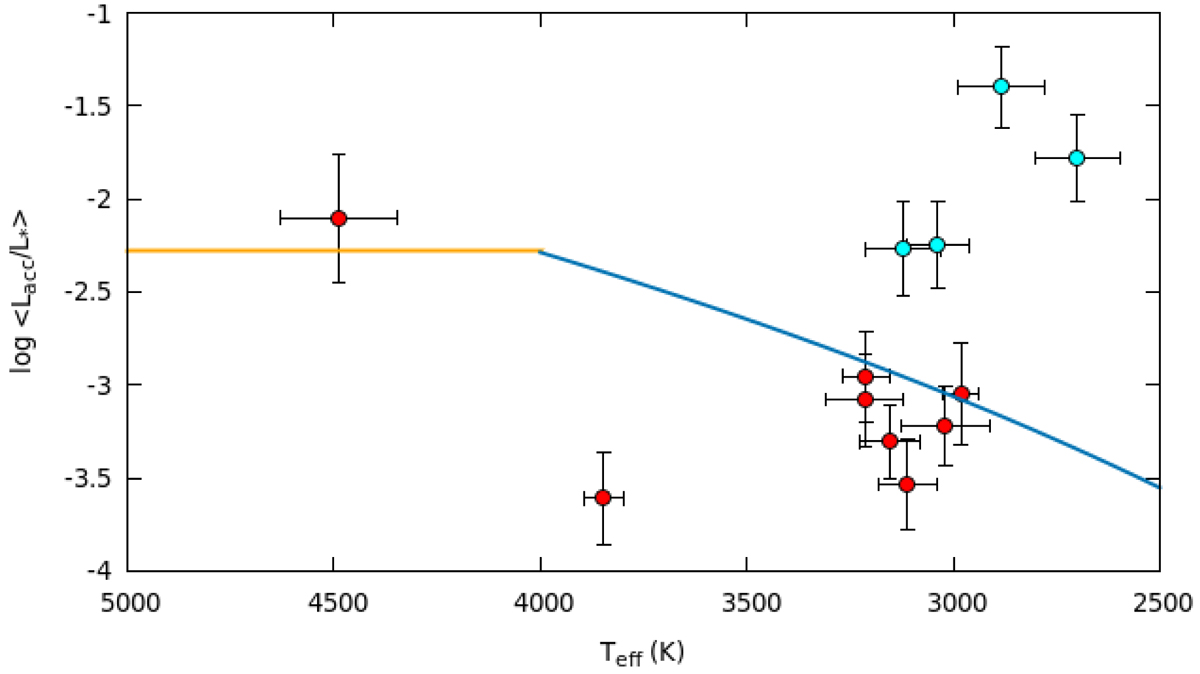
Log ⟨Lacc/L*⟩ versus Teff for all our targets. The cyan dots represent accretors and the red dots represent chromospherically dominant targets. The lines indicate the limit below which the chromospheric activity for a star is dominant (Manara et al. 2017), for two regimes of stars with Teff ≤ 4000 K (the diagonal blue line) and those with Teff ≥ 4000 K (the horizontal orange line).
Current usage metrics show cumulative count of Article Views (full-text article views including HTML views, PDF and ePub downloads, according to the available data) and Abstracts Views on Vision4Press platform.
Data correspond to usage on the plateform after 2015. The current usage metrics is available 48-96 hours after online publication and is updated daily on week days.
Initial download of the metrics may take a while.