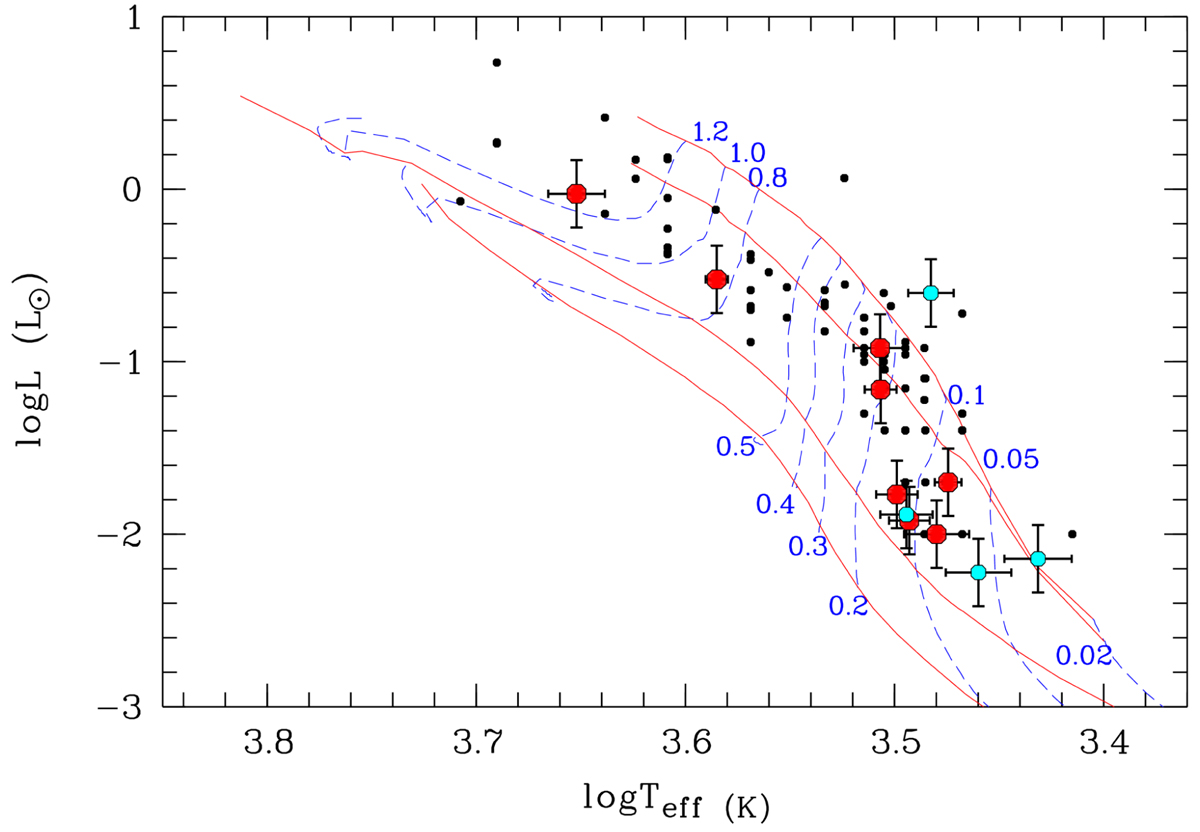
Fig. 7.
Download original image
log L⋆(L⊙) versus log Teff (K) diagram for all our targets (cyan and red dots represent accretors and non-accretors, respectively), together with the previously characterized Lupus members (black dots, Alcalá et al. 2019, subluminous objects are not plotted). Blue dashed lines represent evolutionary tracks of Baraffe et al. (2015) for stars with masses indicated by the number (in M⊙) next to the top or bottom of each track. The red lines indicate isochrones calculated with the same models at ages of 1, 3, 30 Myr and 10 Gyr, from the right to the left.
Current usage metrics show cumulative count of Article Views (full-text article views including HTML views, PDF and ePub downloads, according to the available data) and Abstracts Views on Vision4Press platform.
Data correspond to usage on the plateform after 2015. The current usage metrics is available 48-96 hours after online publication and is updated daily on week days.
Initial download of the metrics may take a while.