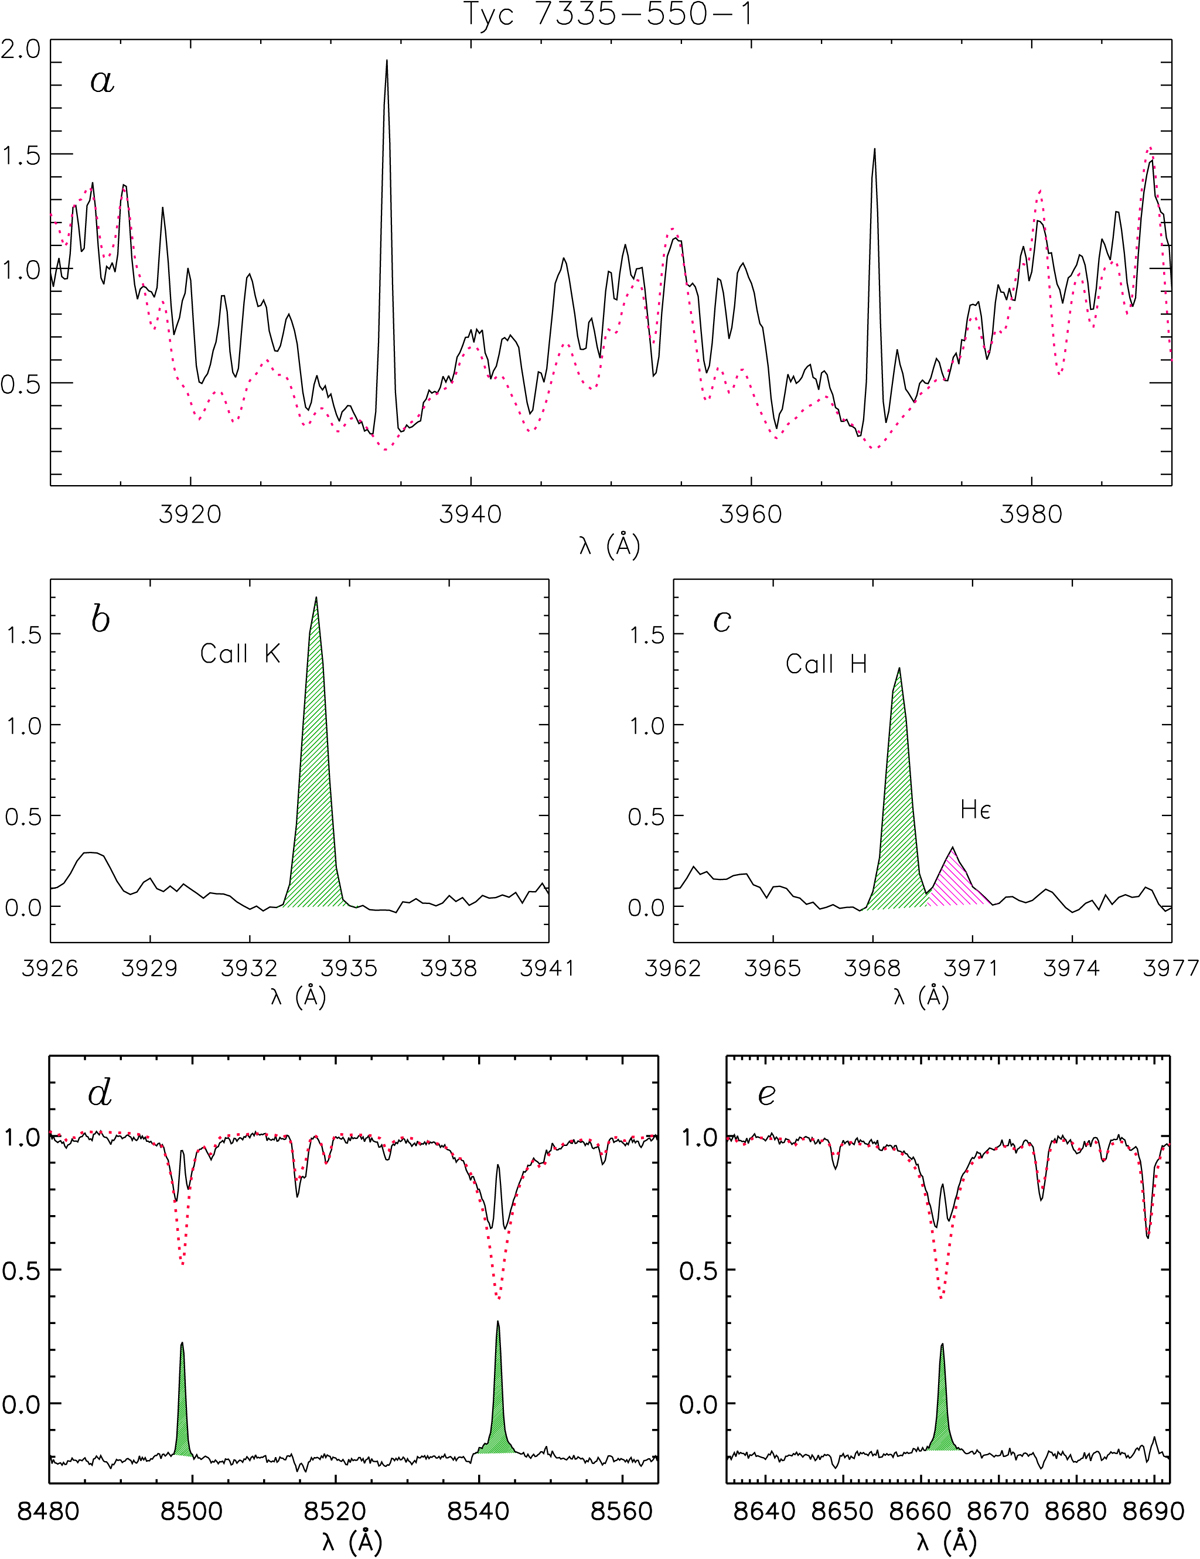
Fig. 5.
Download original image
X-shooter spectra of TYC 7335-550-1 in various wavelength portions. (a) X-shooter UVB spectrum of TYC 7335-550-1 in the Ca II H&K region (black solid line) along with the inactive photospheric template (red dotted line). (b) and (c) Residual (target-template) spectrum around the Ca II K and Ca II H lines, respectively. The hatched green areas mark the residual H and K emissions that have been integrated to obtain the EWs and fluxes. The purple-filled area relates to Hϵ. (d) and (e) Observed Ca II IRT line profiles (black solid lines) with the photospheric template overlaid with red dotted lines. The residual spectra are shown at the bottom of each panel shifted downward by 0.2 in relative flux units for clarity.
Current usage metrics show cumulative count of Article Views (full-text article views including HTML views, PDF and ePub downloads, according to the available data) and Abstracts Views on Vision4Press platform.
Data correspond to usage on the plateform after 2015. The current usage metrics is available 48-96 hours after online publication and is updated daily on week days.
Initial download of the metrics may take a while.