Fig. 3.
Download original image
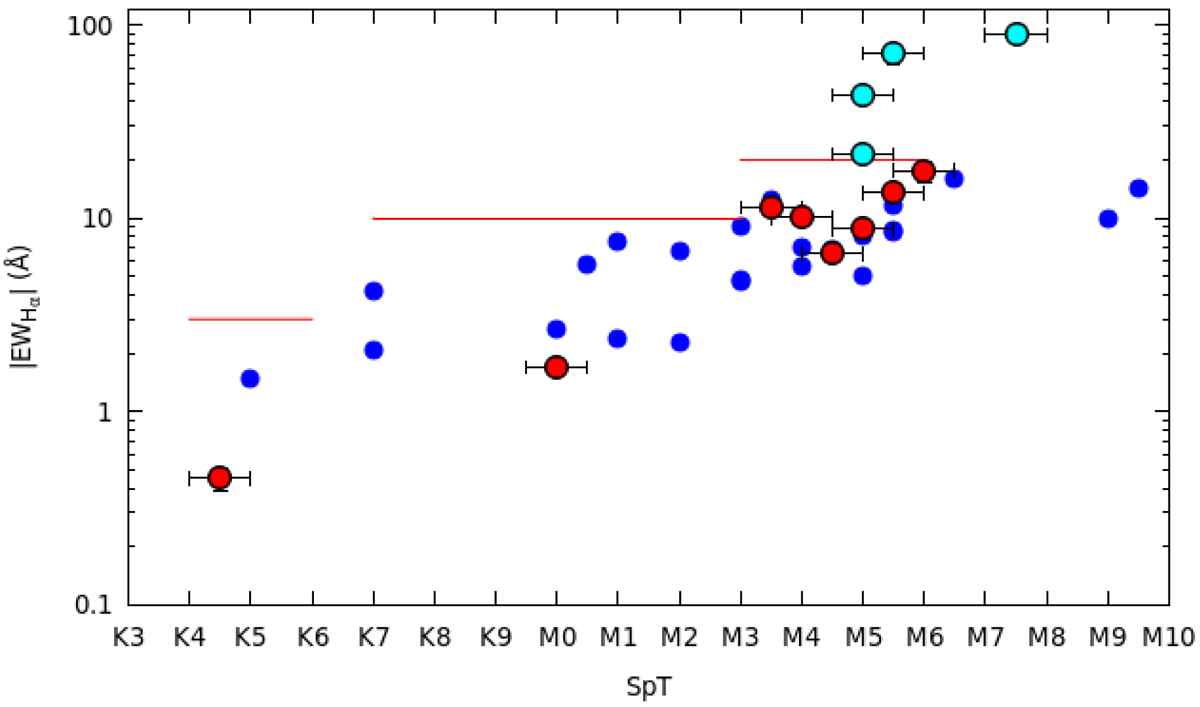
|EWHα| versus SpT of our targets with the weak lined T Tauri stars studied by Manara et al. (2013, blue dots). The cyan dots represent accretors, and the red dots represent chromospherically dominant objects. The horizontal lines in red represent the thresholds that separate non-accreting and accreting objects considering their SpTs (White & Basri 2003).
Current usage metrics show cumulative count of Article Views (full-text article views including HTML views, PDF and ePub downloads, according to the available data) and Abstracts Views on Vision4Press platform.
Data correspond to usage on the plateform after 2015. The current usage metrics is available 48-96 hours after online publication and is updated daily on week days.
Initial download of the metrics may take a while.