Fig. 6.
Download original image
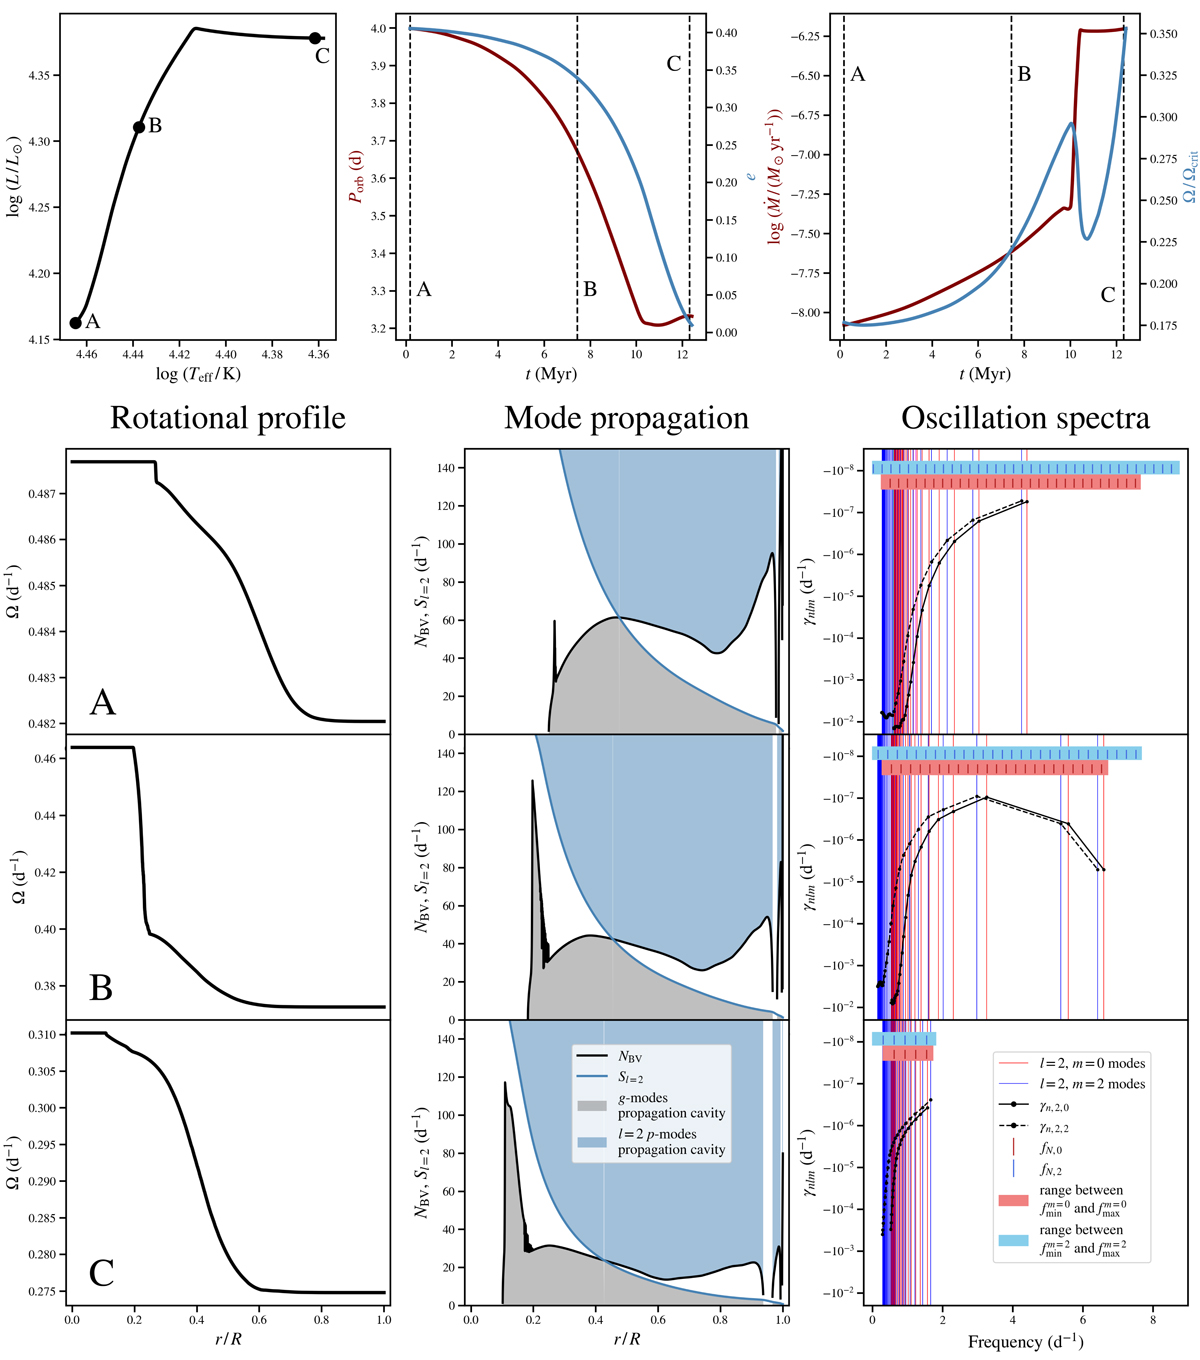
Summary plot of the properties of the primary component of one of the arbitrarily selected binary systems from our simulations. The approximate initial parameters of this particular system were as follows: M1 ≈ 13.6 M⊙, M2 ≈ 3.6 M⊙, e ≈ 0.4, and ![]() . The integration of the system was terminated because of its circularisation. The top row of panels shows, from left to right, evolutionary track in the HRD, the evolution of the orbital period and eccentricity, and the temporal changes of the wind mass-loss rate and surface rotation velocity. The vertical dashed lines in the latter two diagrams correspond to epochs A, B, and C in the HRD. The lower part of the figure shows the internal rotation profile (left column), the mode-propagation diagram (middle column), and the synthetic oscillation spectrum (right column) for epochs A, B, and C (shown in consecutive rows labelled with these letters). The rotation frequency inside the primary is drawn as a function of fractional radius, r/R. The range of rotation frequency is different in the three panels. The mode-propagation diagram shows the dependence of the Brunt–Väisälä frequency (black line) and Lamb frequency for l = 2 modes (blue line) on the fractional radius. The grey and blue shaded areas correspond to the propagation cavities of the g and l = 2 p modes, respectively. The synthetic oscillation spectrum diagrams contain several different pieces of information. The light blue and light red horizontal bars delineate the range of frequencies allowed by the FNm values. In the background of each, the short vertical blue and red lines indicate tidal forcing frequencies that lie within these ranges. The synthetic oscillation spectra calculated by GYRE are marked with long vertical red (σn, 2, 0) and blue (σn, 2, +2) lines. Their corresponding linear damping rates are plotted as solid (γn, 2, 0) and dashed (γn, 2, 2) black lines. The frequency scale on the abscissa axis refers to the rest frame co-rotating with the primary’s core.
. The integration of the system was terminated because of its circularisation. The top row of panels shows, from left to right, evolutionary track in the HRD, the evolution of the orbital period and eccentricity, and the temporal changes of the wind mass-loss rate and surface rotation velocity. The vertical dashed lines in the latter two diagrams correspond to epochs A, B, and C in the HRD. The lower part of the figure shows the internal rotation profile (left column), the mode-propagation diagram (middle column), and the synthetic oscillation spectrum (right column) for epochs A, B, and C (shown in consecutive rows labelled with these letters). The rotation frequency inside the primary is drawn as a function of fractional radius, r/R. The range of rotation frequency is different in the three panels. The mode-propagation diagram shows the dependence of the Brunt–Väisälä frequency (black line) and Lamb frequency for l = 2 modes (blue line) on the fractional radius. The grey and blue shaded areas correspond to the propagation cavities of the g and l = 2 p modes, respectively. The synthetic oscillation spectrum diagrams contain several different pieces of information. The light blue and light red horizontal bars delineate the range of frequencies allowed by the FNm values. In the background of each, the short vertical blue and red lines indicate tidal forcing frequencies that lie within these ranges. The synthetic oscillation spectra calculated by GYRE are marked with long vertical red (σn, 2, 0) and blue (σn, 2, +2) lines. Their corresponding linear damping rates are plotted as solid (γn, 2, 0) and dashed (γn, 2, 2) black lines. The frequency scale on the abscissa axis refers to the rest frame co-rotating with the primary’s core.
Current usage metrics show cumulative count of Article Views (full-text article views including HTML views, PDF and ePub downloads, according to the available data) and Abstracts Views on Vision4Press platform.
Data correspond to usage on the plateform after 2015. The current usage metrics is available 48-96 hours after online publication and is updated daily on week days.
Initial download of the metrics may take a while.