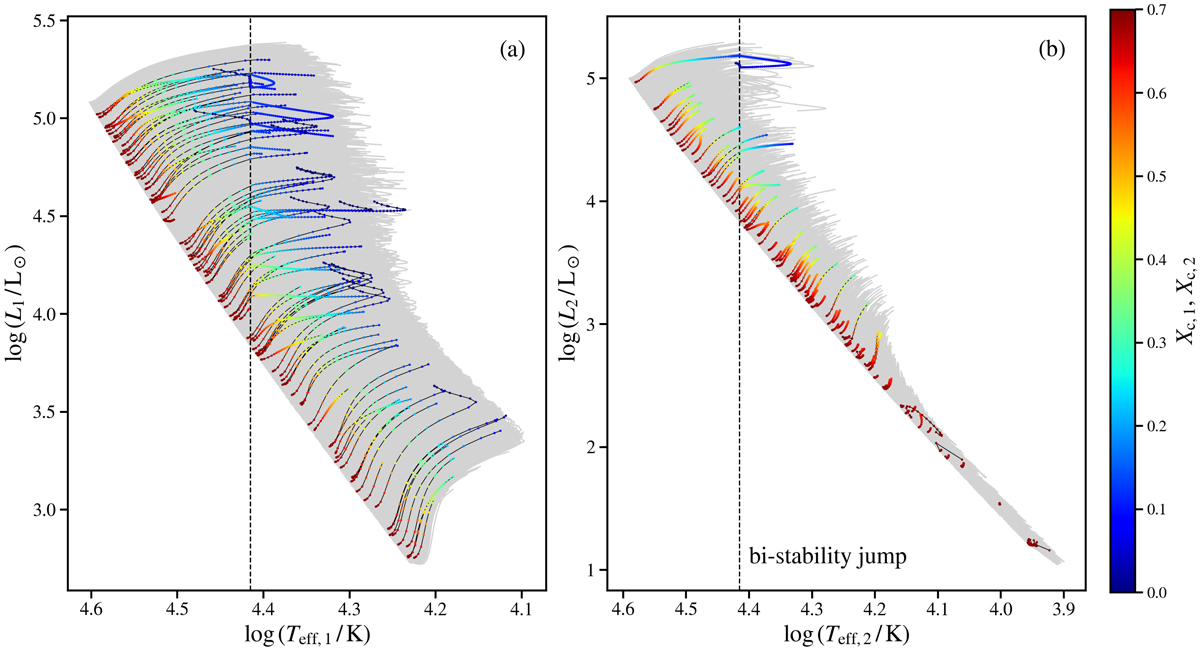
Fig. 4.
Download original image
Evolutionary tracks of primary and secondary components obtained from our simulations. (a) HRD with the evolutionary tracks of primary components. The grey area corresponds to the region occupied by the full set of 20 000 tracks, while a subsample of 100 randomly selected tracks is indicated with coloured points connected by solid black lines. Each point represents one saved MESA model. The colour-coding reflects the central hydrogen abundance. The effective temperature of the bi-stability jump (Teff ≈ 26 000 K) is marked with the vertical dashed line. The abrupt change in the behaviour of some evolutionary tracks after crossing the bi-stability jump region is due to a significant change in the wind mass-loss rate. (b) Same as panel a, but for a set of secondary components. We note the difference in the ranges of the two axes in panels a and b. More details are discussed in the main text.
Current usage metrics show cumulative count of Article Views (full-text article views including HTML views, PDF and ePub downloads, according to the available data) and Abstracts Views on Vision4Press platform.
Data correspond to usage on the plateform after 2015. The current usage metrics is available 48-96 hours after online publication and is updated daily on week days.
Initial download of the metrics may take a while.