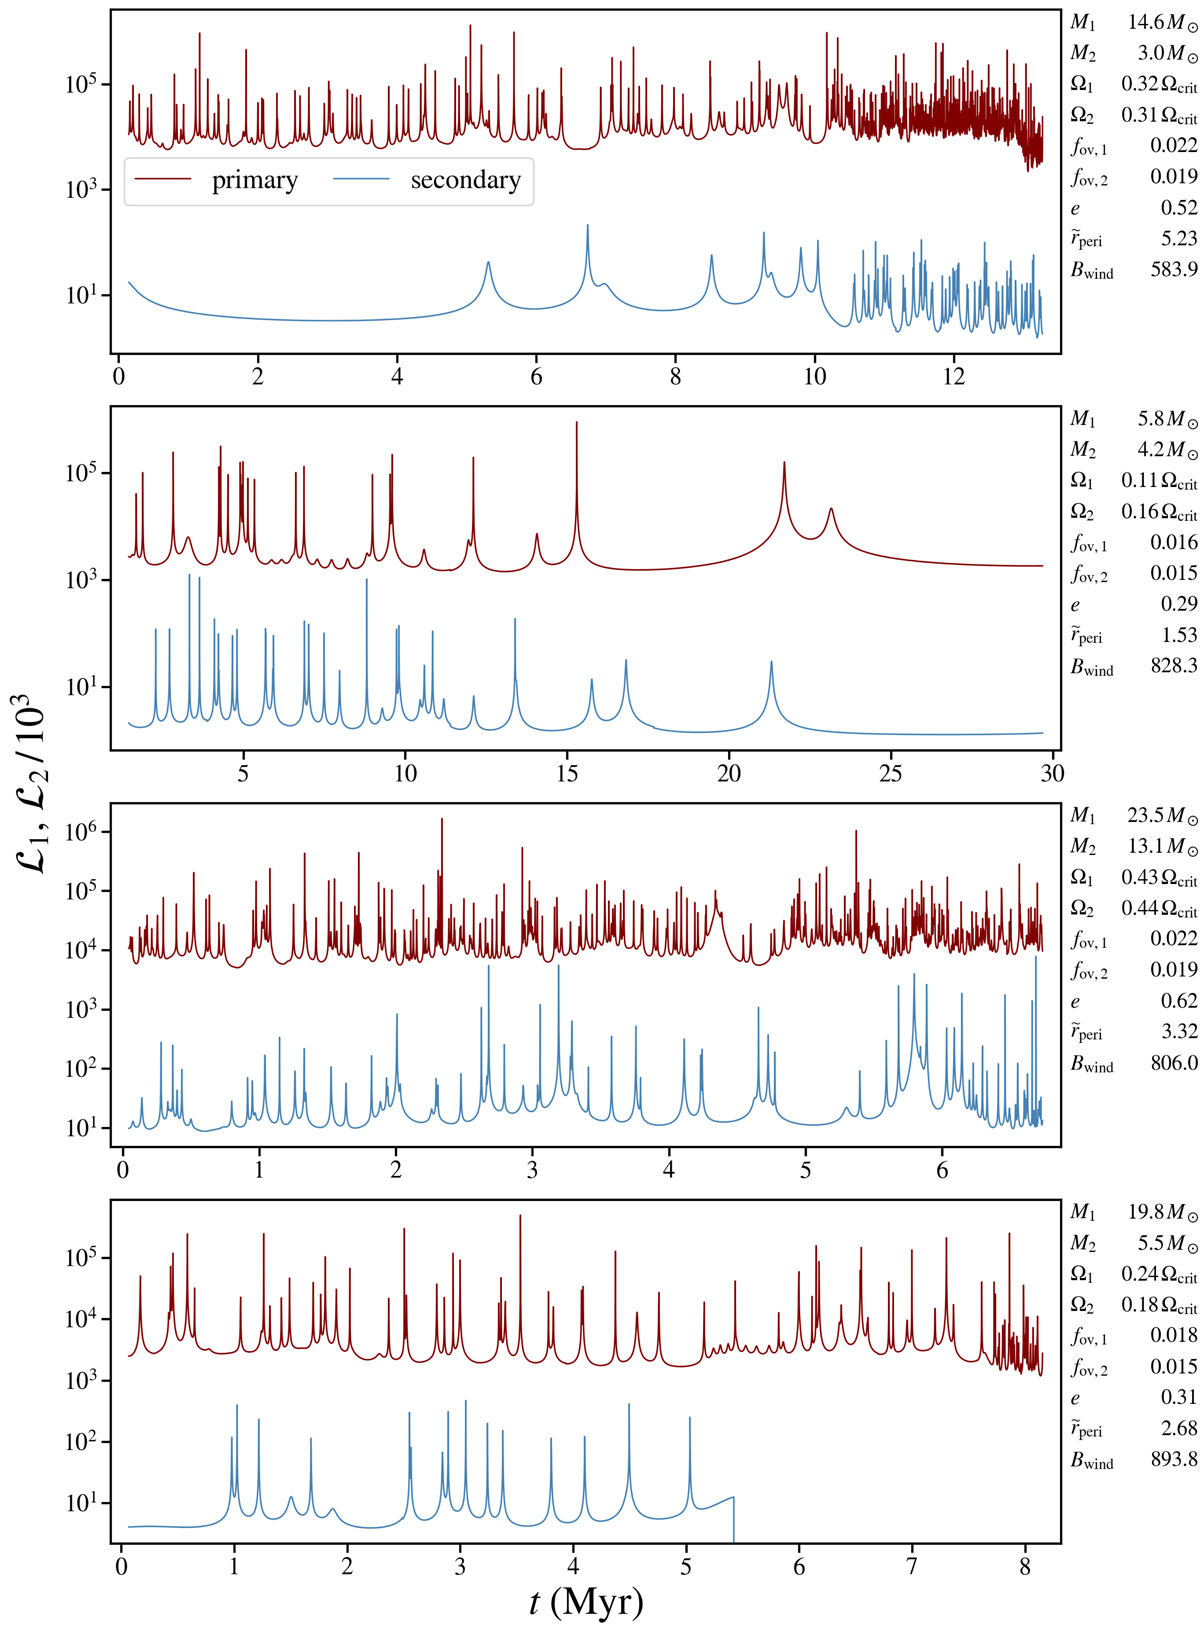
Fig. 3.
Download original image
Sample of resonance curves obtained as described in Sect. 3. Each panel corresponds to a different arbitrarily chosen binary system, with the rounded values of their initial parameters given on the right. The dark red and blue curves reflect the behaviour of ℒ(t) for the primary and secondary components, respectively. For clarity, ℒ2(t) has been shifted vertically by three orders of magnitude downwards. Time t = 0 indicates the ZAMS. A sudden break in ℒ2(t) in the bottom panel (after about 5.5 Myr) indicates ℒ2 = 0, i.e. the absence of any resonances. The differences in the height of the peaks are due to different values of γnlm and min{|σnlm − fNm|} for excited TEOs.
Current usage metrics show cumulative count of Article Views (full-text article views including HTML views, PDF and ePub downloads, according to the available data) and Abstracts Views on Vision4Press platform.
Data correspond to usage on the plateform after 2015. The current usage metrics is available 48-96 hours after online publication and is updated daily on week days.
Initial download of the metrics may take a while.