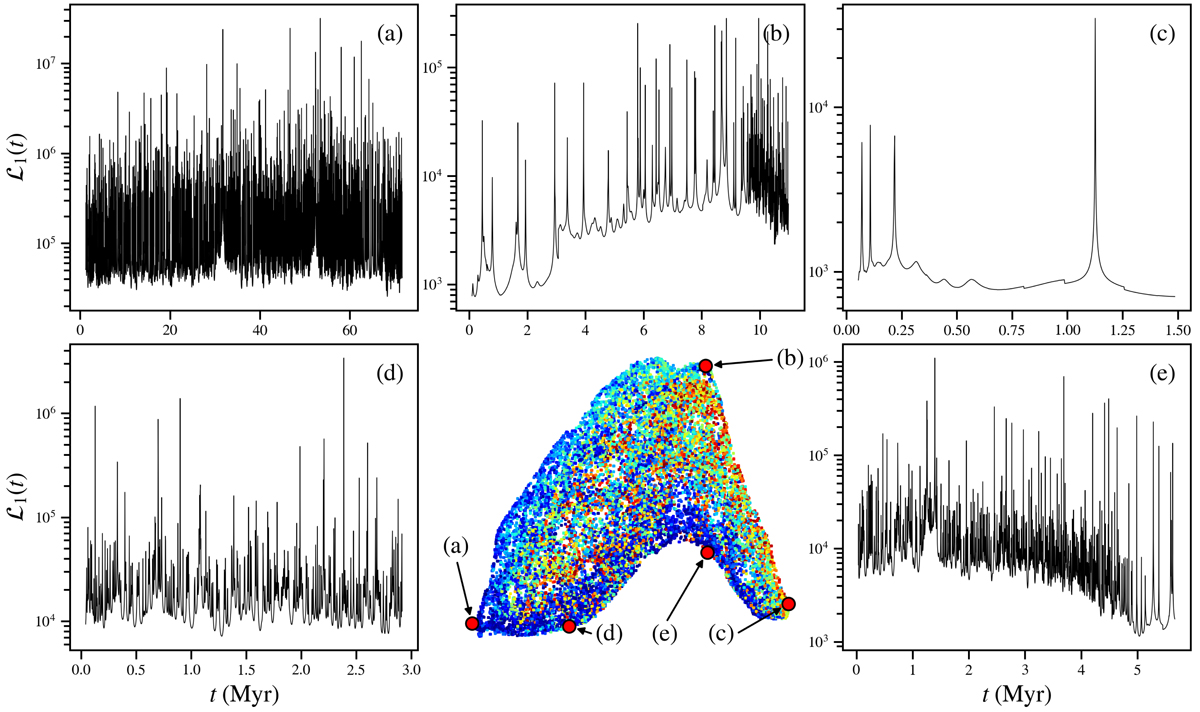
Fig. 13.
Download original image
Variations in the morphology of the resonance curve for the primary component across the 2D UMAP plane from Fig. 12. The middle panel in the bottom row shows the plane with colour-coding identical to that in Fig. 12a (without hexagonal binning). Panels a–e, which surround the area, show example resonance curves that correspond to the locations on the area masked with large red dots and labelled according to the associated panel. The positions of points (a)–(d) have been chosen in such a way as to correspond to different extreme positions on the plane, while point (e) refers to one of the intermediate cases. A discussion of the figure can be found in Sect. 4.5.
Current usage metrics show cumulative count of Article Views (full-text article views including HTML views, PDF and ePub downloads, according to the available data) and Abstracts Views on Vision4Press platform.
Data correspond to usage on the plateform after 2015. The current usage metrics is available 48-96 hours after online publication and is updated daily on week days.
Initial download of the metrics may take a while.