Fig. 12.
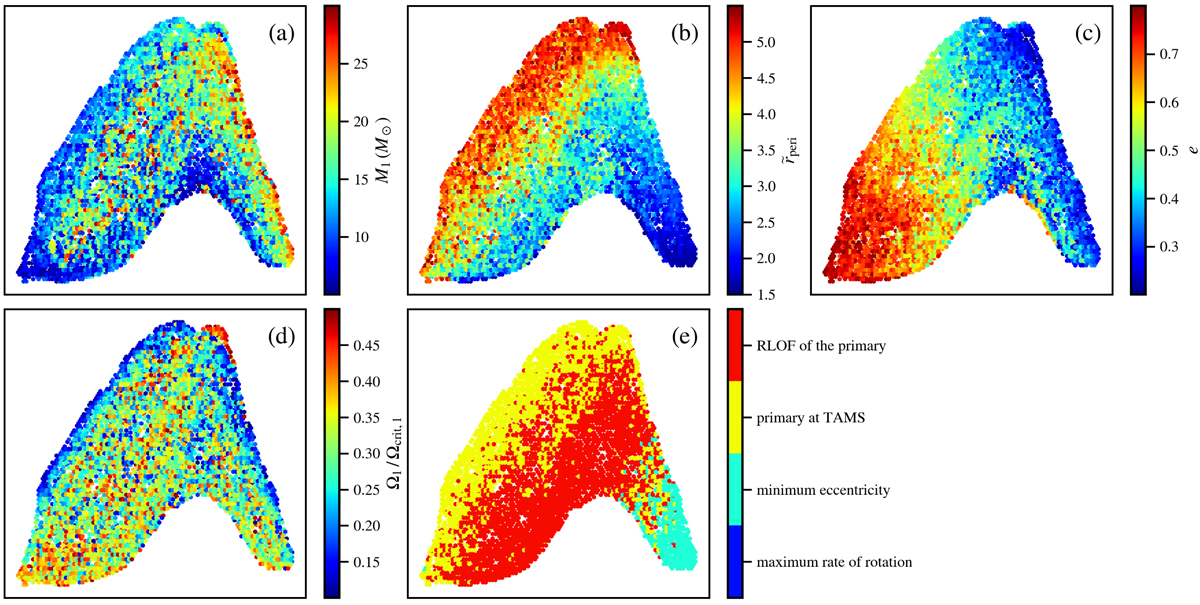
Download original image
2D UMAP embedding of the manifold spanned by the morphological features of the resonance curves of the primary components. For details on how to obtain the presented embedding, see Sect. 3.5. Panels a–d are colour-coded with respect to the initial parameters of the simulated EEVs, as shown on the corresponding colour bars. The other initial parameters were omitted as they were not significantly related to the location of the points on the presented map. The different colours of points in panel e correspond to the termination condition, as shown in the legend on the right. The values on the abscissa and ordinate axes were omitted as they have no physical meaning. For clarity, the colour-coded features have been averaged within the small hexagonal areas in each panel. A discussion of the figure can be found in Sect. 4.5.
Current usage metrics show cumulative count of Article Views (full-text article views including HTML views, PDF and ePub downloads, according to the available data) and Abstracts Views on Vision4Press platform.
Data correspond to usage on the plateform after 2015. The current usage metrics is available 48-96 hours after online publication and is updated daily on week days.
Initial download of the metrics may take a while.