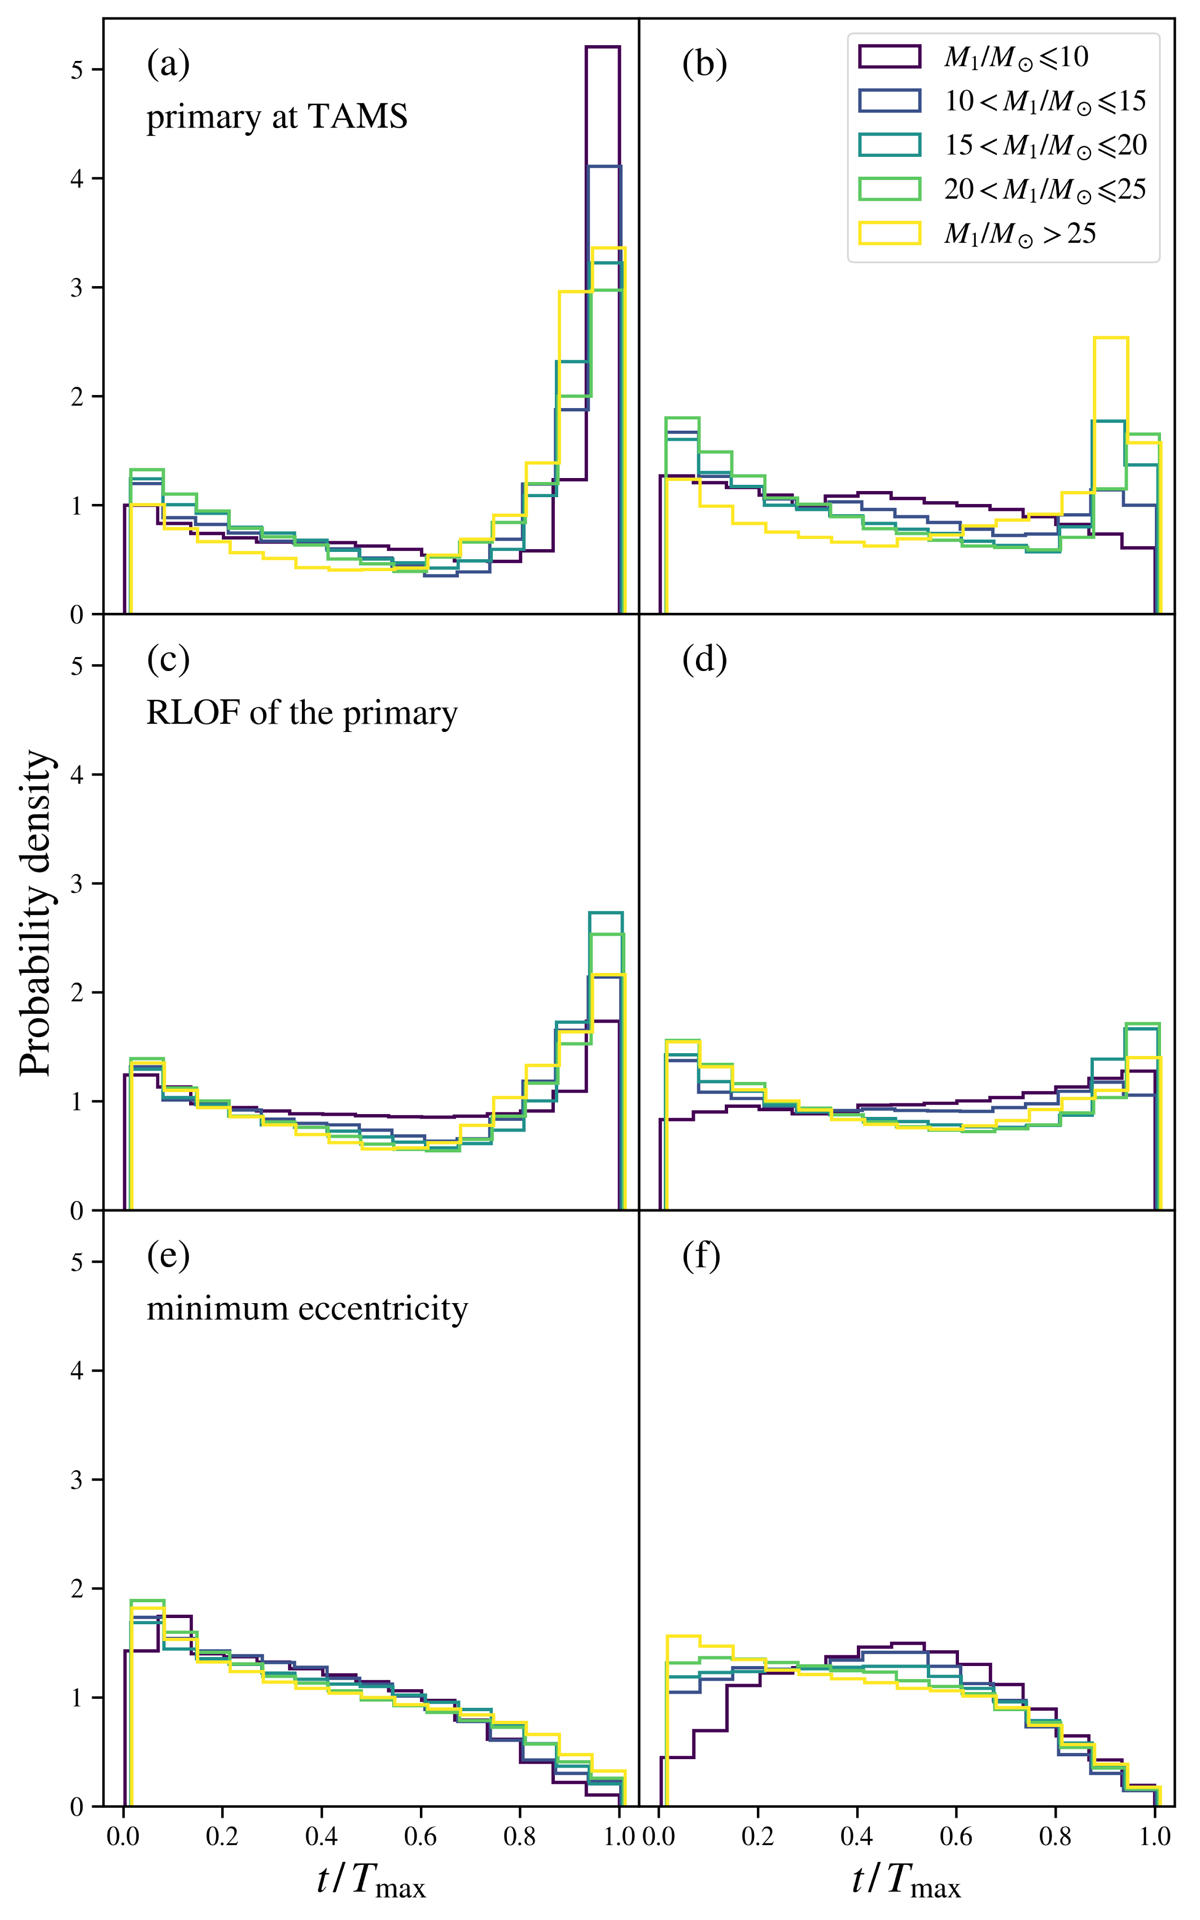
Fig. 11.
Download original image
Histograms of the normalised times of resonances occurring in the primary (left column) and secondary (right column) components. The consecutive rows (from top to bottom) correspond to EEVs that satisfy different termination conditions, as labelled in panels a, c, and e. The colour of the histogram is related to the initial mass range of the primary and is described in the legend in panel b. We note that the histograms on the right (corresponding to the secondaries) refer to the different mass ranges of the primary component, not the secondary. For example, the yellowish histogram in panel b summarises the behaviour of all secondaries of the systems whose primaries have masses M1 > 25 M⊙, i.e. without distinguishing the mass ranges of M2. The range of the ordinate axes is the same in each panel.
Current usage metrics show cumulative count of Article Views (full-text article views including HTML views, PDF and ePub downloads, according to the available data) and Abstracts Views on Vision4Press platform.
Data correspond to usage on the plateform after 2015. The current usage metrics is available 48-96 hours after online publication and is updated daily on week days.
Initial download of the metrics may take a while.