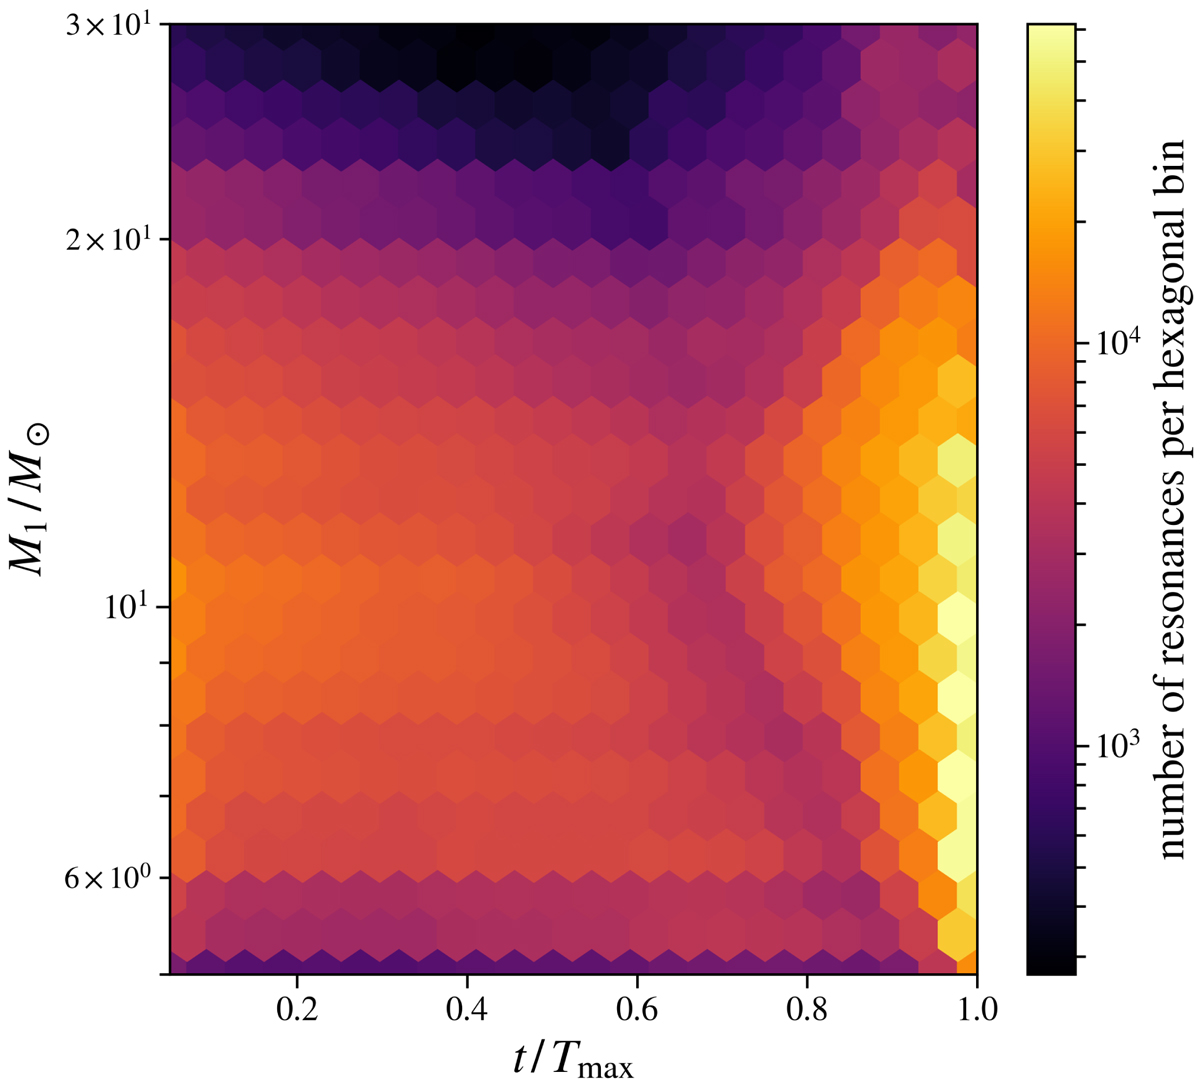
Fig. 10.
Download original image
Time distribution of the resonances of the primary component that reached the TAMS. The abscissa axis corresponds to the normalised time, and the ordinate shows the initial mass of the primary component. In addition, the ordinate is logarithmically scaled, so the set of resonance curves is almost uniformly distributed in the vertical direction. The total number of resonances contained in one hexagonal bin is colour-coded according to the scale on the right.
Current usage metrics show cumulative count of Article Views (full-text article views including HTML views, PDF and ePub downloads, according to the available data) and Abstracts Views on Vision4Press platform.
Data correspond to usage on the plateform after 2015. The current usage metrics is available 48-96 hours after online publication and is updated daily on week days.
Initial download of the metrics may take a while.