Fig. 2.
Download original image
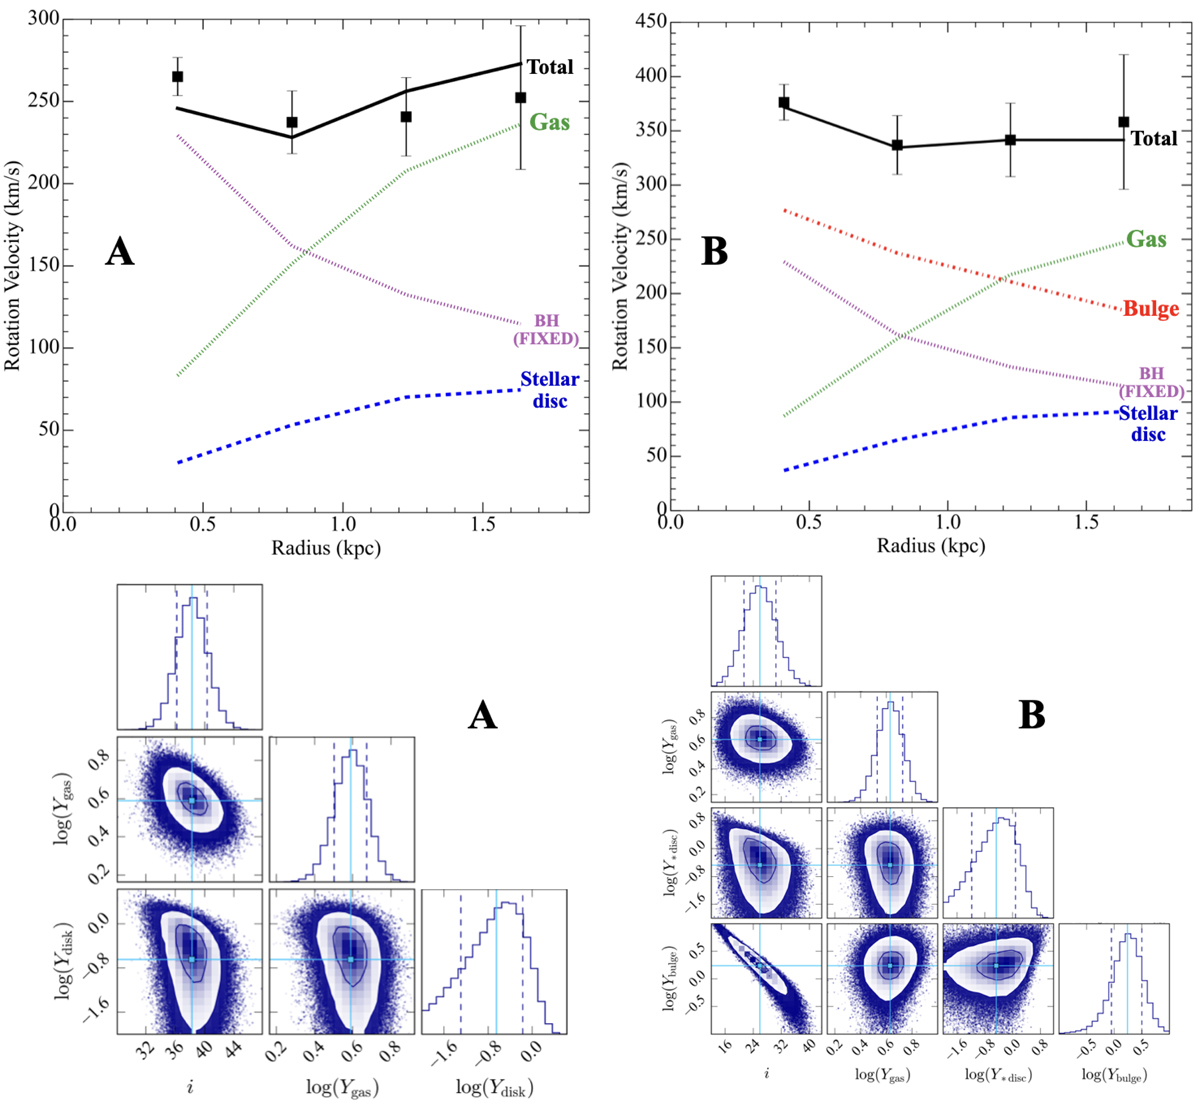
Results for mass models. Top panels: Two different mass models are fitted to the observed rotation curve (black squares): no bulge and fixed BH mass (A), bulge and fixed BH mass (B). The best-fitting model (solid black line) is the sum of the contributions from the stellar disc (dashed blue line), the cold gas disc (dotted green line), the BH (dotted purple line), and the stellar bulge (when present; dot-dashed red line). The different values of the rotation velocities in models A and B are due to different best-fitting values for the inclination: i = 38 ± 2° for model A and i = 26 ± 4° for model B. Bottom panels: Posterior distributions of the fitting parameters for models A and B.
Current usage metrics show cumulative count of Article Views (full-text article views including HTML views, PDF and ePub downloads, according to the available data) and Abstracts Views on Vision4Press platform.
Data correspond to usage on the plateform after 2015. The current usage metrics is available 48-96 hours after online publication and is updated daily on week days.
Initial download of the metrics may take a while.