Fig. 1.
Download original image
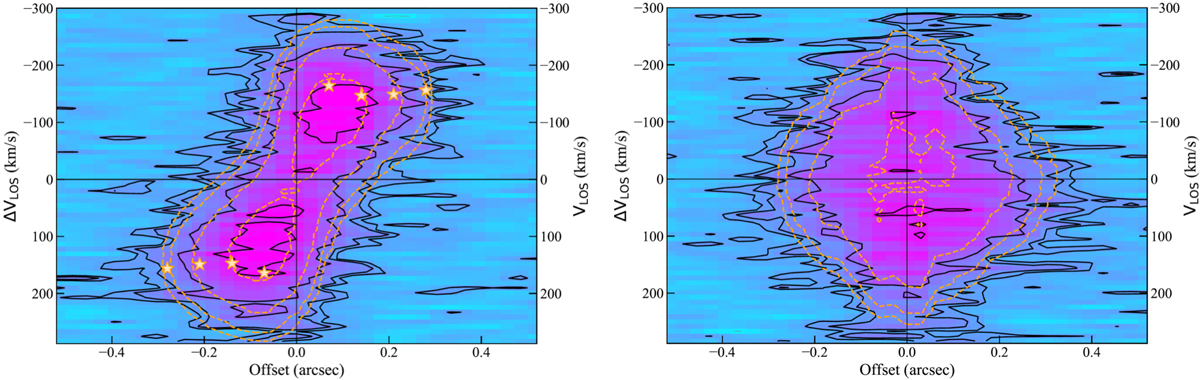
PV diagrams of the [CII] emission line along the kinematic major axis (left panel) and kinematic minor axis (right panel), performed with 3DBarolo. Contours are at 2, 3, 6, and 12σ, with σ = 0.22 mJy beam−1, for the data (solid black lines) and the best-fit model (dashed orange lines). Yellow stars show the projected rotation curve modelled by 3DBarolo.
Current usage metrics show cumulative count of Article Views (full-text article views including HTML views, PDF and ePub downloads, according to the available data) and Abstracts Views on Vision4Press platform.
Data correspond to usage on the plateform after 2015. The current usage metrics is available 48-96 hours after online publication and is updated daily on week days.
Initial download of the metrics may take a while.