Fig. 1

Download original image
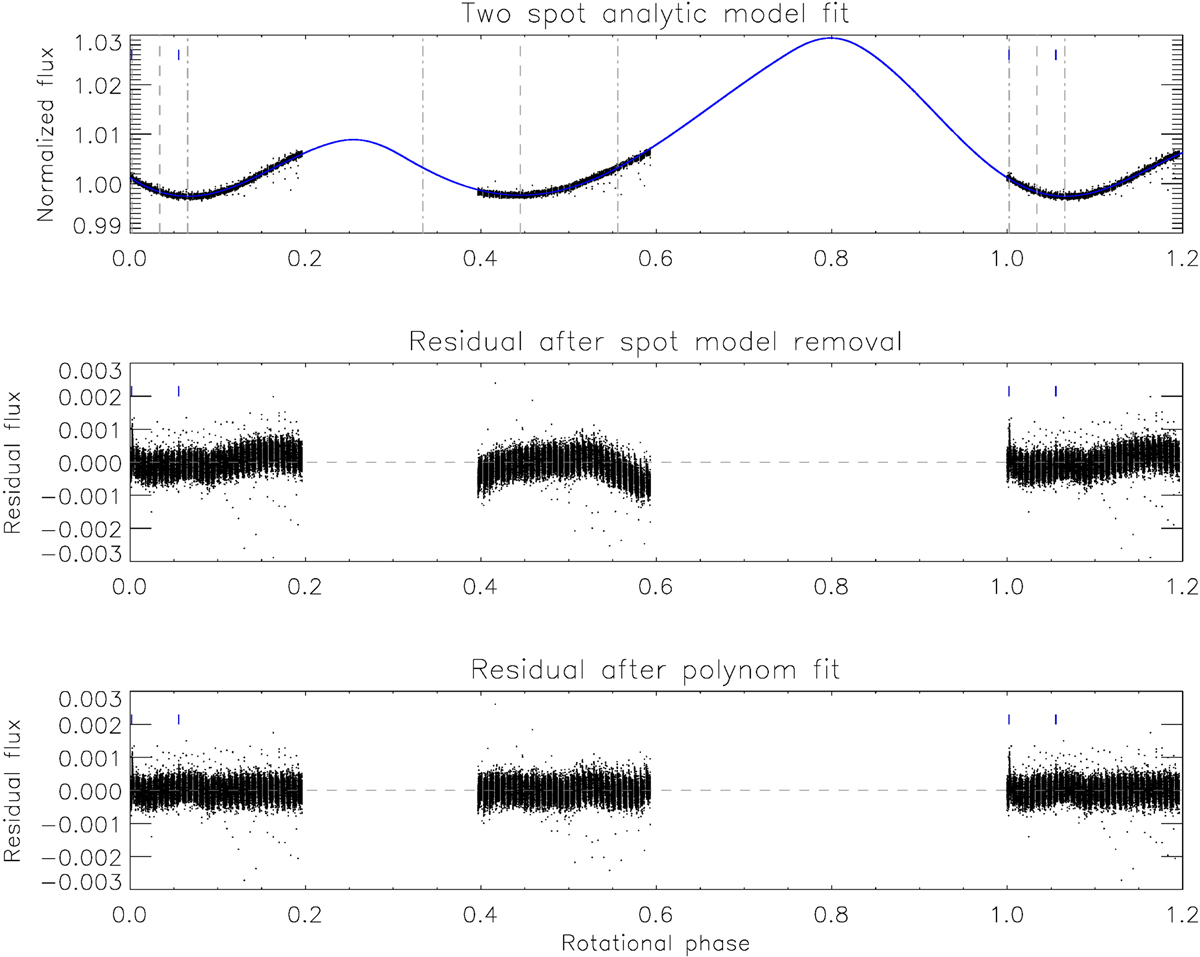
Analytical spot model fitted to our CHEOPS data. Upper panel: CHEOPS light curve (black dots) with the fitted analytic spot model (blue solid line). Dashed lines denote the longitudes of the fitted spots while dash-dotted lines indicate the radii of these spots. Middle panel: residual after subtraction of the spot model. Lower panel: residual after subtraction of the low-order polynomial. Blue ticks denote the positions of the two observed flares. The light curve is phased following Eq. (1) with Prot = 10.39 days.
Current usage metrics show cumulative count of Article Views (full-text article views including HTML views, PDF and ePub downloads, according to the available data) and Abstracts Views on Vision4Press platform.
Data correspond to usage on the plateform after 2015. The current usage metrics is available 48-96 hours after online publication and is updated daily on week days.
Initial download of the metrics may take a while.


