Open Access
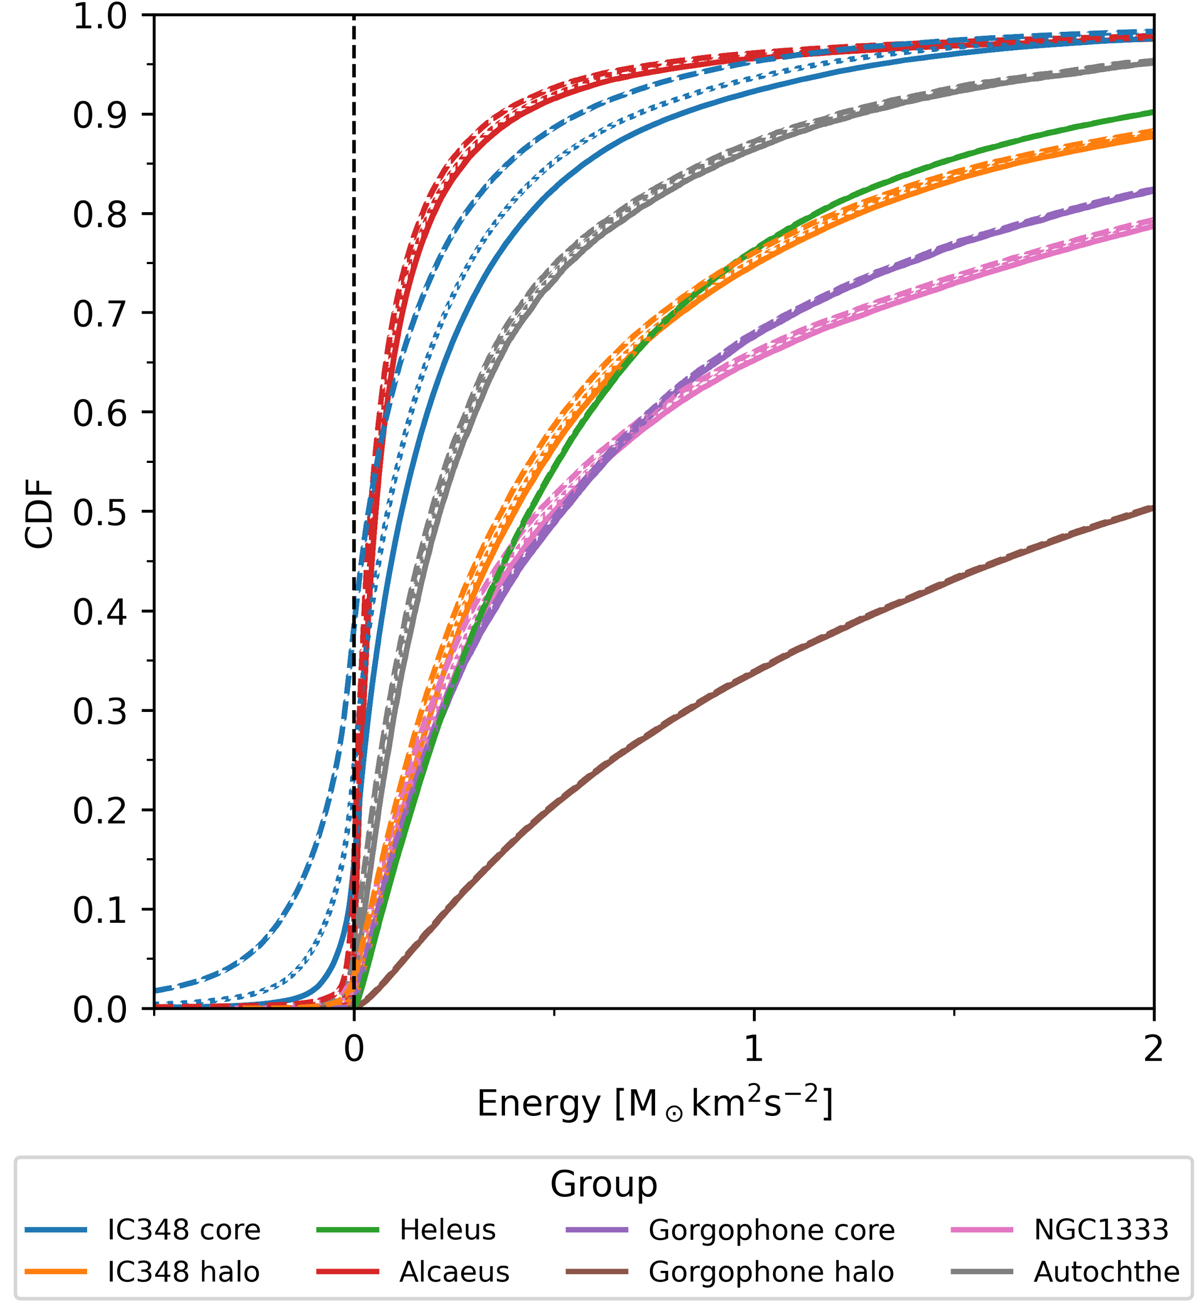
Fig. 9.
Download original image
Cumulative energy distributions of the Perseus groups. The dotted and dashed lines depict the results of accounting for the dust and gas mass by increasing the stellar mass by 65% and 169%, respectively.
Current usage metrics show cumulative count of Article Views (full-text article views including HTML views, PDF and ePub downloads, according to the available data) and Abstracts Views on Vision4Press platform.
Data correspond to usage on the plateform after 2015. The current usage metrics is available 48-96 hours after online publication and is updated daily on week days.
Initial download of the metrics may take a while.