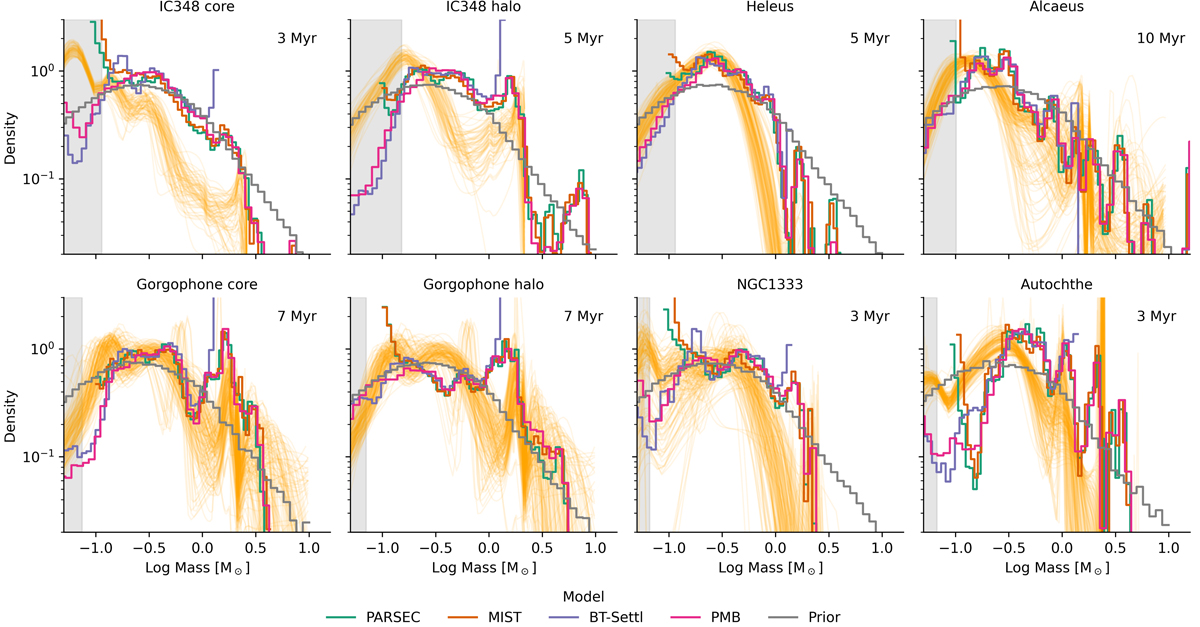
Fig. 6.
Download original image
Mass distributions of the Perseus groups. The orange lines show 100 realisations from the mass distribution obtained after transforming Miec’s magnitude distributions (see text). The rest of the coloured lines (those of the legend) depict the mass distributions computed with Sakam. The grey area shows the Gaia incompleteness region.
Current usage metrics show cumulative count of Article Views (full-text article views including HTML views, PDF and ePub downloads, according to the available data) and Abstracts Views on Vision4Press platform.
Data correspond to usage on the plateform after 2015. The current usage metrics is available 48-96 hours after online publication and is updated daily on week days.
Initial download of the metrics may take a while.