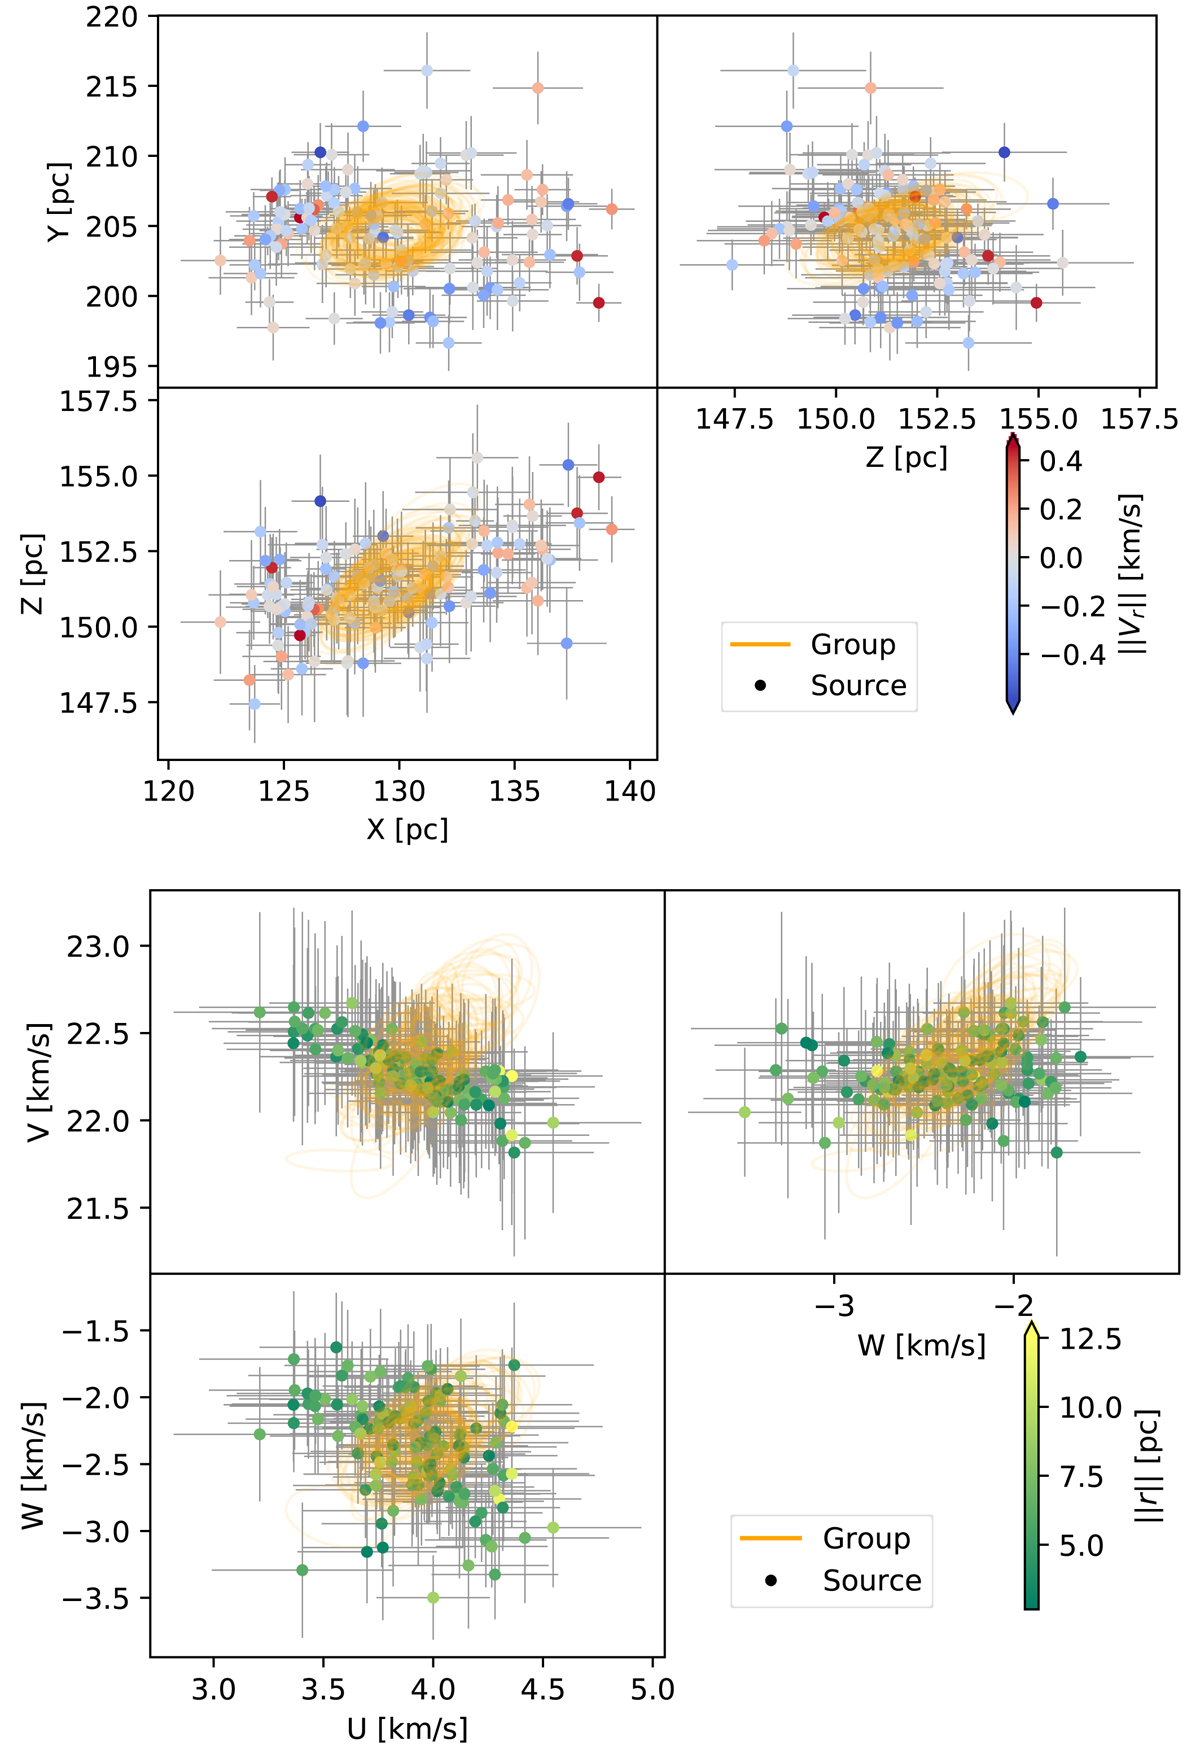
Fig. 3.
Download original image
Cartesian equatorial (ICRS) positions (top panel) and velocities (bottom panel) of the Alcaeus group. The colour code shows the speed (top panel) and the distance (bottom panel) in the radial direction and both relative to the group centre. The orange ellipses show samples from the posterior distribution of the group-level parameters (see Fig. 2).
Current usage metrics show cumulative count of Article Views (full-text article views including HTML views, PDF and ePub downloads, according to the available data) and Abstracts Views on Vision4Press platform.
Data correspond to usage on the plateform after 2015. The current usage metrics is available 48-96 hours after online publication and is updated daily on week days.
Initial download of the metrics may take a while.