Fig. 9.
Download original image
Absolute bias ![]() and dispersion
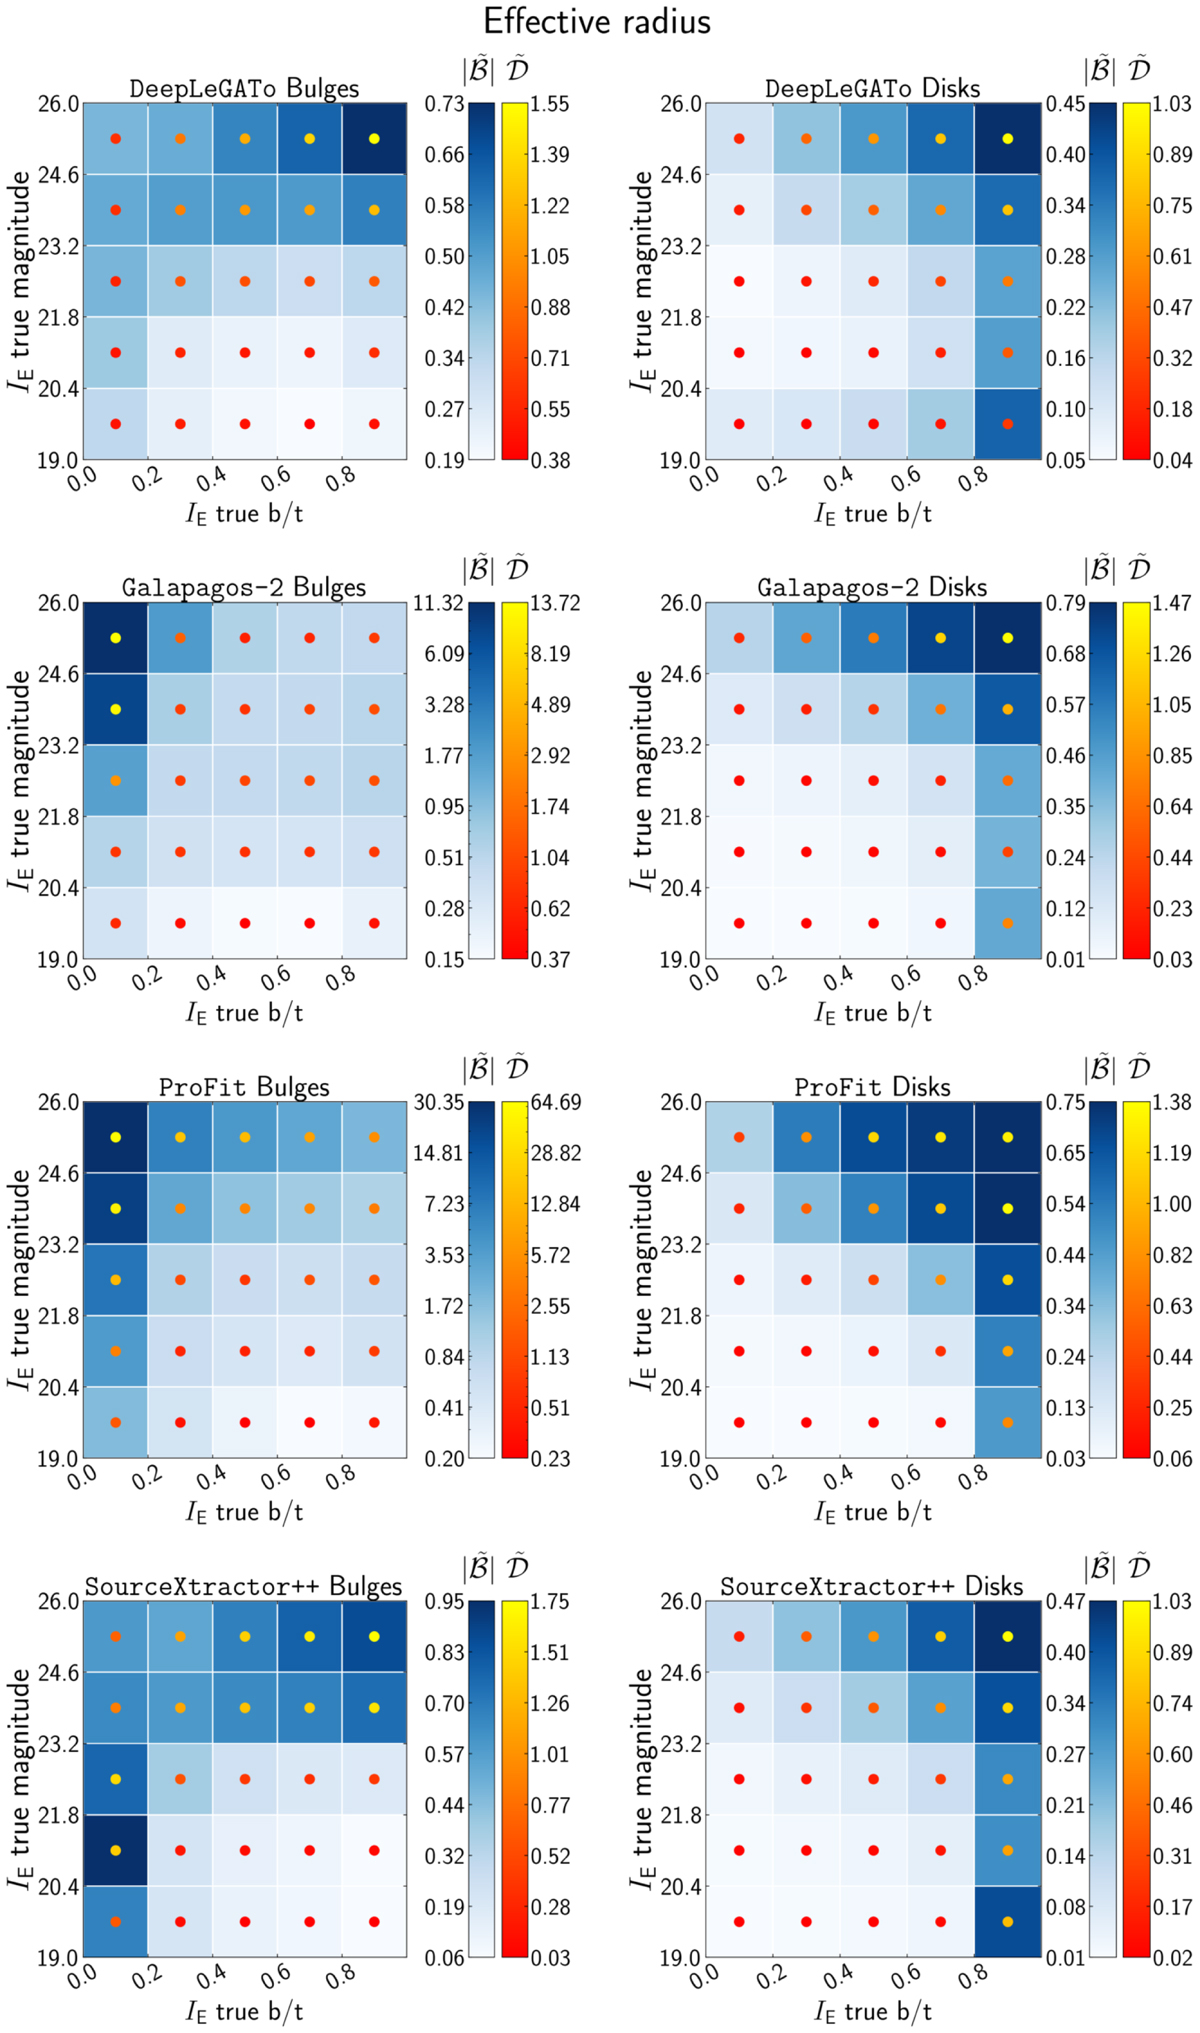
and dispersion ![]() for the effective radius of bulge (left column) and disc (right column) components in the double-Sérsic simulation, as a function of bulge-to-total ratio (x-axis) and apparent IE magnitude (y-axis). Each row shows a different code. For ProFit and Galapagos-2, the colour scale is logarithmic. In each panel, the colour of the squares is proportional to the mean bias 𝒟 (lighter being smaller), and the colour of the dot inside each square indicates the dispersion 𝒟 (redder being lower). For most of the codes, we find the expected behaviour: both the bias and the dispersion increase for faint objects, as well as at small b/t for bulges and large b/t for discs.
for the effective radius of bulge (left column) and disc (right column) components in the double-Sérsic simulation, as a function of bulge-to-total ratio (x-axis) and apparent IE magnitude (y-axis). Each row shows a different code. For ProFit and Galapagos-2, the colour scale is logarithmic. In each panel, the colour of the squares is proportional to the mean bias 𝒟 (lighter being smaller), and the colour of the dot inside each square indicates the dispersion 𝒟 (redder being lower). For most of the codes, we find the expected behaviour: both the bias and the dispersion increase for faint objects, as well as at small b/t for bulges and large b/t for discs.
Current usage metrics show cumulative count of Article Views (full-text article views including HTML views, PDF and ePub downloads, according to the available data) and Abstracts Views on Vision4Press platform.
Data correspond to usage on the plateform after 2015. The current usage metrics is available 48-96 hours after online publication and is updated daily on week days.
Initial download of the metrics may take a while.