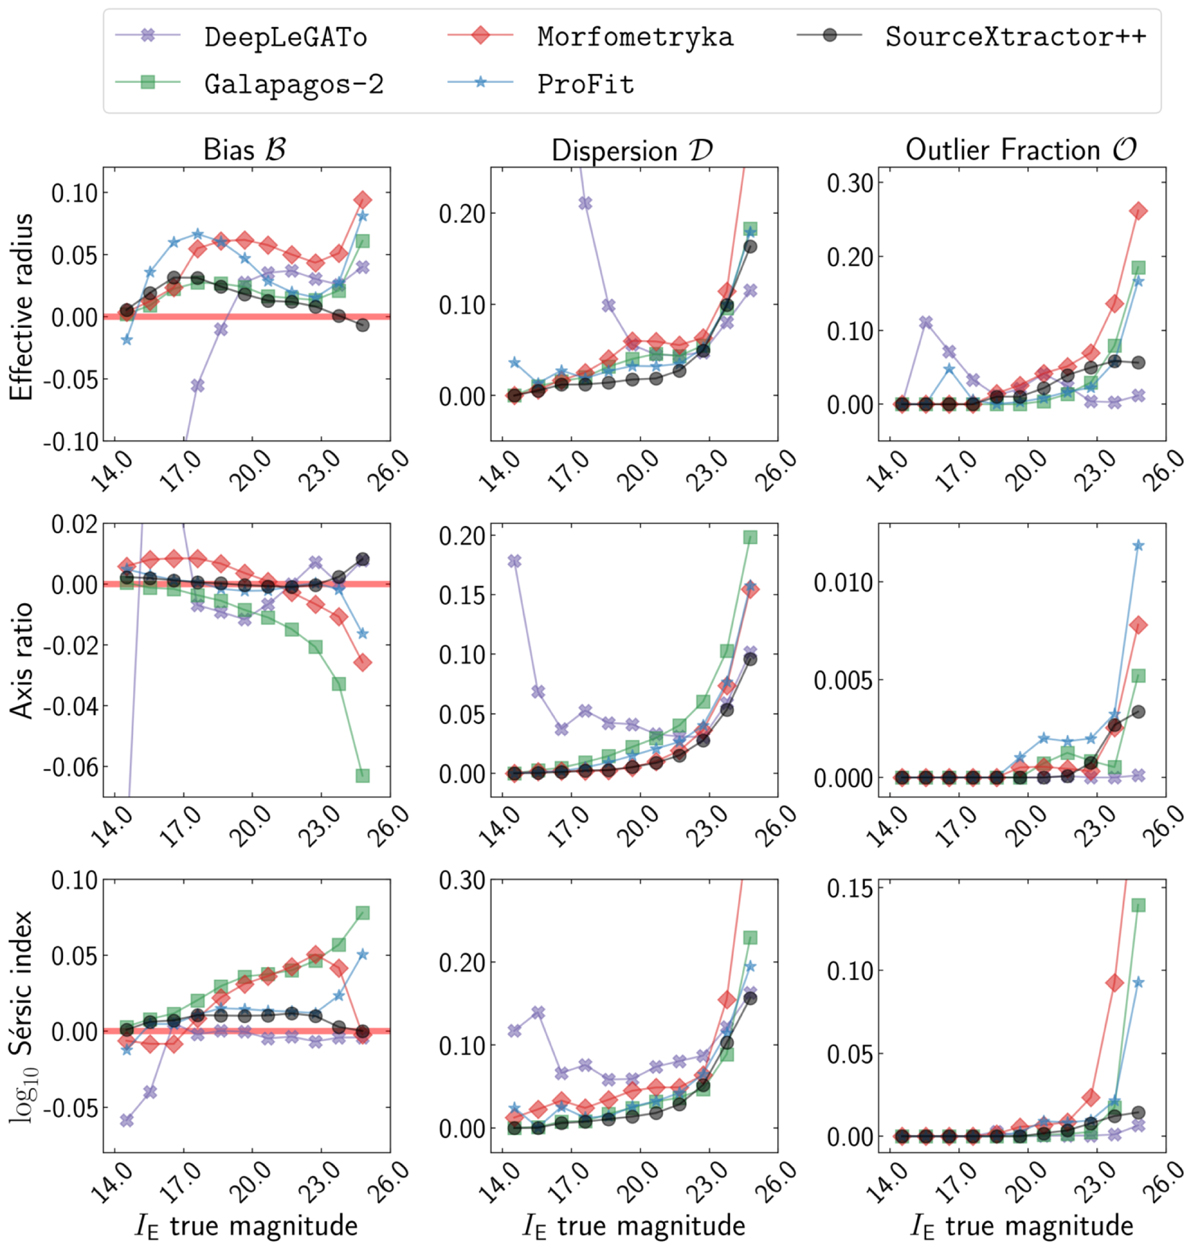
Fig. 6.
Download original image
Summary plot for the single-Sérsic simulation. The different rows show the results for the three different structural parameters: half-light radius re (top), axis ratio q (middle) and Sérsic index n (bottom). Columns represent (1) the mean bias ℬ, (2) the dispersion 𝒟, and (3) the fraction of outliers 𝒪, per bin of IE magnitude (see text for details). We note that the y-axis is sometimes cut at low values to highlight the small differences between the software packages. Each code is plotted with a different colour as labelled.
Current usage metrics show cumulative count of Article Views (full-text article views including HTML views, PDF and ePub downloads, according to the available data) and Abstracts Views on Vision4Press platform.
Data correspond to usage on the plateform after 2015. The current usage metrics is available 48-96 hours after online publication and is updated daily on week days.
Initial download of the metrics may take a while.