Fig. 22.
Download original image
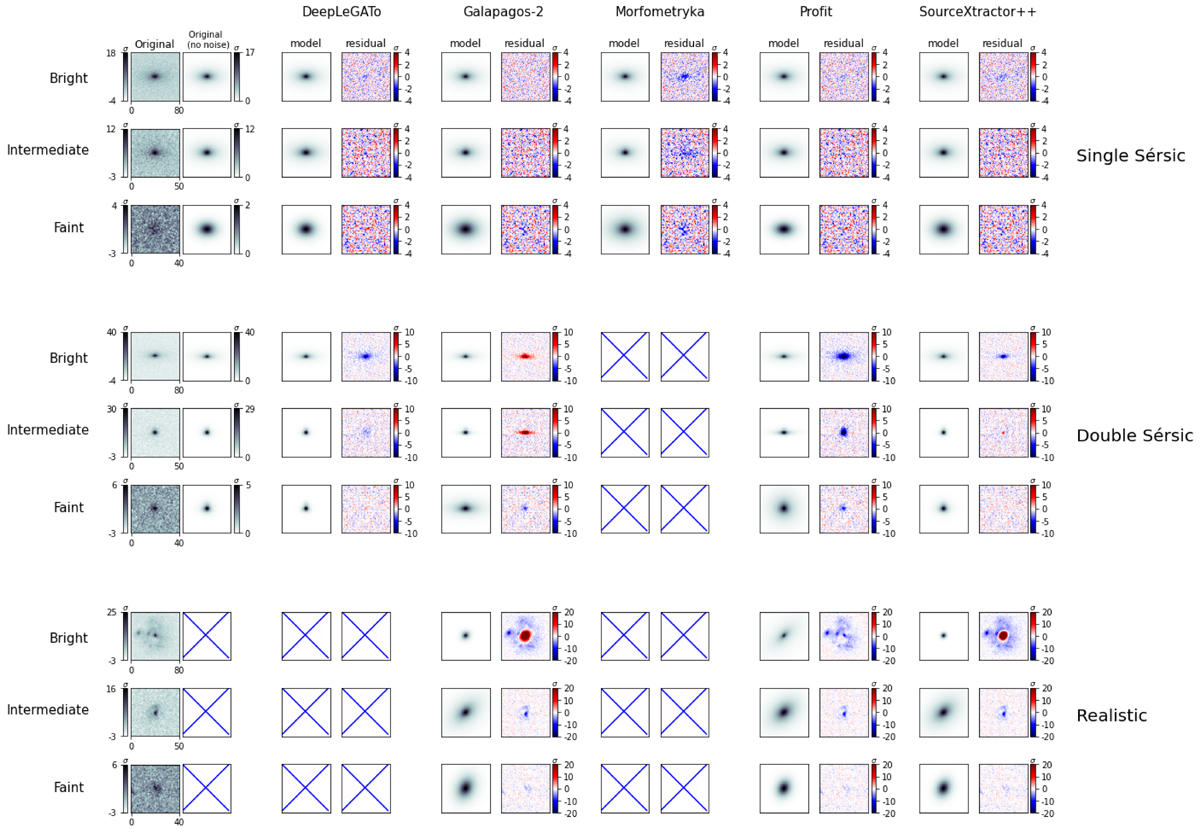
Illustration of residuals from the galaxy modelled with the predicted parameters by the different software packages. The plot has the same structure for the three types of simulations (single-Sérsic in the first three rows, double-Sérsic in the three middle rows, and realistic galaxies in the last three rows). For each type, the first row presents a bright galaxy, the second an intermediate galaxy, and the third a faint one). In the two first columns, we show the actual image of the galaxy, with and without noise. Then, each pair of columns presents: (1) the noiseless model constructed from the predicted parameters of each code, and (2) the residual between the noisy true galaxy and the noise-less model. All the colour bars are related to the Euclid Wide Survey noise level. For this reason, a perfect model would lead to a colour bar ranging from −3σ and 3σ. Finally, to better capture the details of the residuals, we clipped the value to a certain σ value, which is fixed for all the codes and magnitudes in a certain type of simulation. For the residuals, the colour bar is symmetric, centred on zero.
Current usage metrics show cumulative count of Article Views (full-text article views including HTML views, PDF and ePub downloads, according to the available data) and Abstracts Views on Vision4Press platform.
Data correspond to usage on the plateform after 2015. The current usage metrics is available 48-96 hours after online publication and is updated daily on week days.
Initial download of the metrics may take a while.