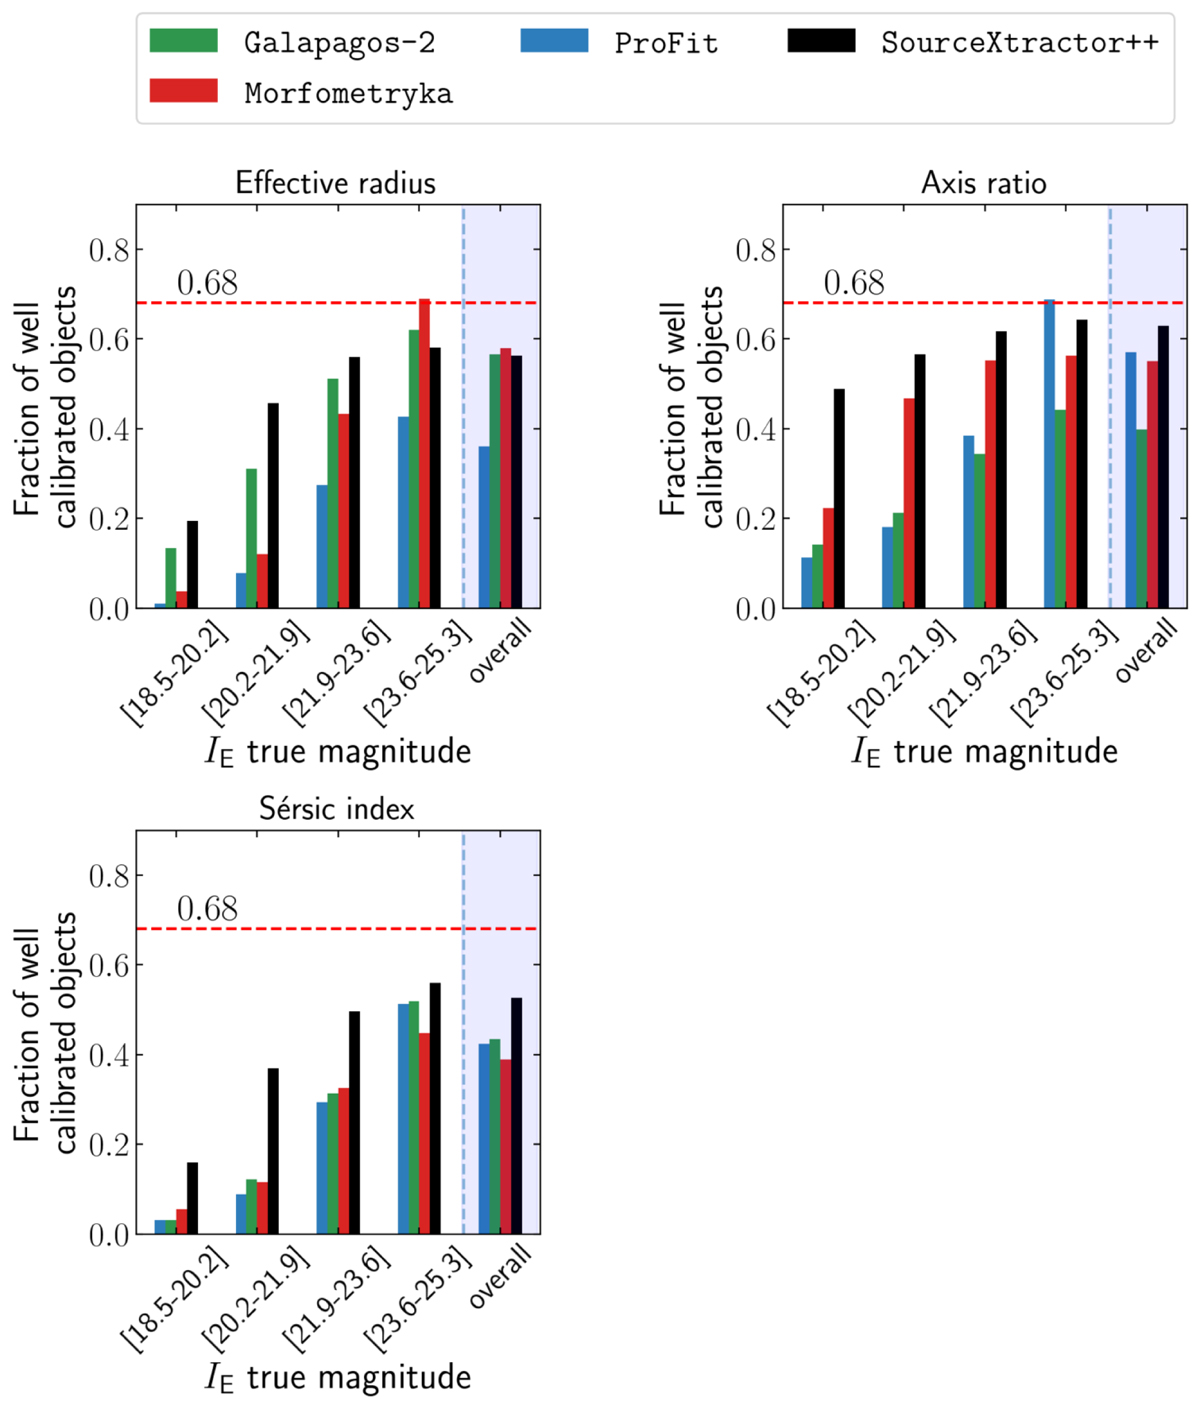
Fig. 20.
Download original image
Uncertainty calibration for the single-Sérsic simulation. The x-axis represents four bins of IE magnitude. The y-axis shows the fraction of object per bin of magnitude for which the True value of a parameter falls in an interval of the predicted 1σ uncertainty centred on the predicted value. The final bin is for all objects, regardless of their magnitude.
Current usage metrics show cumulative count of Article Views (full-text article views including HTML views, PDF and ePub downloads, according to the available data) and Abstracts Views on Vision4Press platform.
Data correspond to usage on the plateform after 2015. The current usage metrics is available 48-96 hours after online publication and is updated daily on week days.
Initial download of the metrics may take a while.