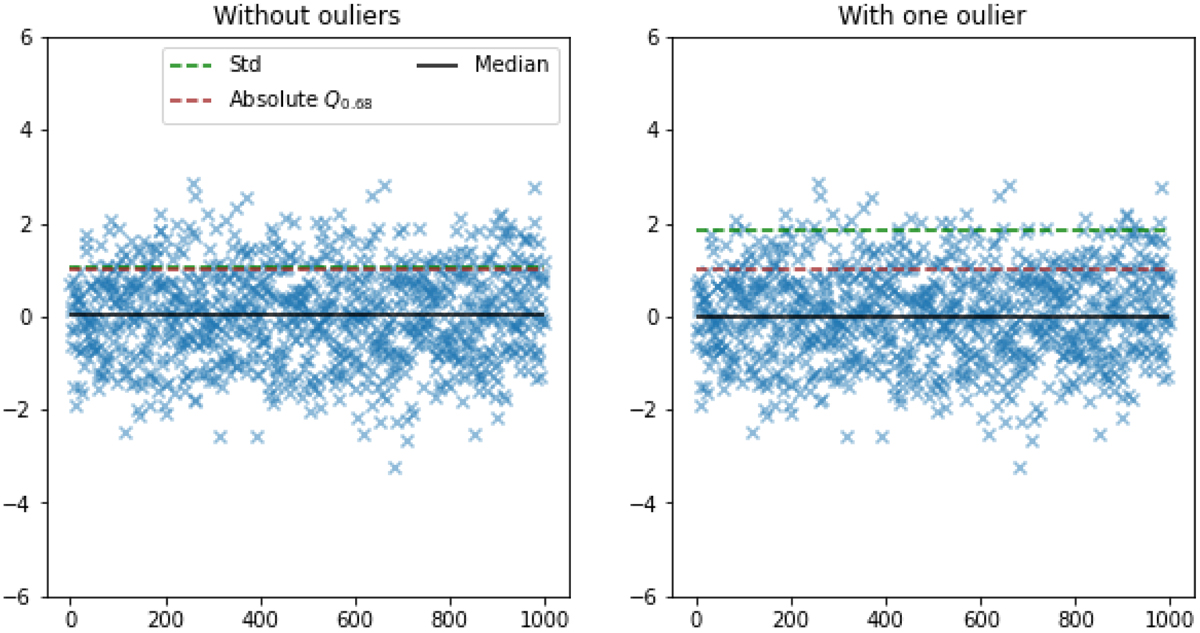
Fig. 2.
Download original image
Illustration of our dispersion metric choice. In both plot, we plot the median, the standard deviation and our definition of the dispersion, defined Eq. (8) for a Normal Gaussian distribution. In the right figure, we add an outlier at y = 100. We can see that our definition is not sensible of the presence of an outlier, compared to the standard deviation.
Current usage metrics show cumulative count of Article Views (full-text article views including HTML views, PDF and ePub downloads, according to the available data) and Abstracts Views on Vision4Press platform.
Data correspond to usage on the plateform after 2015. The current usage metrics is available 48-96 hours after online publication and is updated daily on week days.
Initial download of the metrics may take a while.